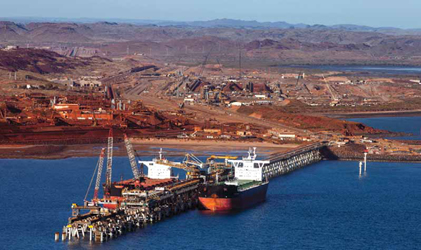
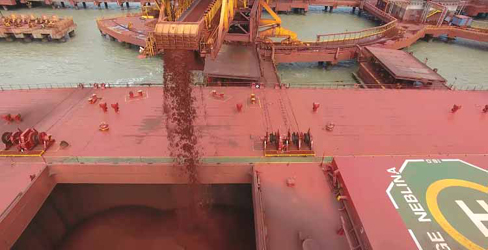
In 2016, Rio Tinto regained its status as the No. 2 iron ore producer. Above, the first ship is loaded
with Pilbara iron ore at Cape Lambert from Rio Tintos 290-million-mt/y expansion program.
Iron Ore Market Report 2017
Prices and demand for high-quality iron ore increases. Future over capacity could
threaten lower quality and high cost iron ore operations.
By Anton Löf and Magnus Ericsson
Economic growth strengthened somewhat in developed countries and in China in 2016. World crude steel production also increased in 2016 by 0.6%. The increase in production was an improvement compared to the decline of 3% in 2015. Noteworthy is the increase in crude steel production in India where production rose 7.4%.
Chinese crude steel production decreased in 2015 for the first time in decades, but in 2016, production increased by 0.6%. At 808 million metric tons (mt), China continues to be, by far, the largest producer. In 2016, roughly 50% of total world crude steel was produced in China almost exactly the same proportions as the year before.
According to the Organization for Economic Cooperation and Development (OECD), the worlds steelmaking capacity increased from a level of 1,050 million mt to 2,390 million mt between 2000 and 2016. Meanwhile, steel production, according to the World Steel Association, over the same period rose from 848 million mt to 1,620 million mt. This suggests that the overcapacity has risen from 202 million mt in 2010 to 770 million mt in 2015. This equals to a utilization rate of 81% in 2000 compared to 68% in 2016. Last year (2016), crude steelmaking capacity increased by 30 million mt per year (mt/y).
Global steel exports remained relatively flat during the year. According to OECD estimates, world exports were 314 million mt in 2016 down from 317 million mt. The exports of many countries declined, China by 3.1%, Japan by 0.7%, the European Union (EU) by 12% and Korea by 1.8%. This was partially offset by the growth in the CIS region where Russia increased its export by 5.1% and Ukraine by 2.9%. However, Chinese exports are still dominating with 34% of the world total. While the growth rate in Chinese exports seems to have abated, the total volume is still a source of concern to many other steel producers. The OECD noted that trade measures have increased in the last few years, which could explain the slowdown in the growth of steel exports during 2016.
The steel demand recovery during 2016 also impacted steel prices. The world steel price index, which had trended downward since 2011, rose sharply in 2016. Further there has been a shift in the demand structure with hot-rolled coil prices increasing at a faster rate than rebar prices.
Iron Ore Production
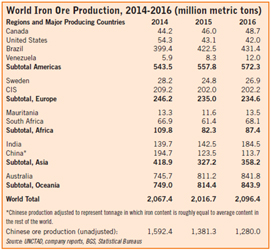
In 2016, the iron ore market returned to
growth following the contraction of 2015.
Global output of iron ore increased by 4%
to 2.096 billion mt in 2016. Output not
only increased in the two most important
producing countries, Australia and Brazil,
it also increased in India and South
Africa. Australia continues to grow faster
than Brazil. In 2016, the former grew by
3.8%, to 842 million mt, and the latter
by 2.1% to 431 million mt.
Asian production, which reached a peak in 2007 at 647 million mt, has declined almost every year since, mainly due to shrinking output in China and India. In China, output fell 7.9% in 2016, to 114 million mt. The national Chinese production figures for un-beneficiated ores corroborates these figures with a decline of 7.3%. In India, the downward trend may have turned, with production increasing slightly in both 2014 and 2015. In 2016, Indian iron ore production grew by 30% and reached 185 million mt. An impressive feat by the country that has been plagued by policies hampering growth, Indian iron ore production fell from 224 million mt in 2009 to 136 million mt in 2013. In 2015, exports were down to 4.2 million mt well below the 2009 peak of 224 million mt.
In Europe, including CIS, production declined by 0.2% in 2016, down to 235 million mt. Among declining production in most countries, Sweden and LKAB managed to increase production by 8.5%. LKABs pellet products are in high demand as a consequence. African production increased by 6.2% to 87 million mt in 2016. In Africa, the two major producing countries, South Africa and Mauritania, both increased production, the former by 11% and the latter by 16%. Following the bankruptcy of several new miners within Africa, this is indeed good news.
During the last couple of years, with the exceptional increase in production from mainly Australia and the falling production in China and India, the share of iron ore being produced by developed countries has increased substantially. In 2016, the fall in Chinese production together with the expansion in Australia could, however, not stop the increase in the portion of world iron ore output accounted for by developing countries: from 43.5% in 2015 to 44.2% in 2016. The recovery of the Indian iron ore production is one of the reasons for this trend break.
Iron Ore Trade
The growth in global iron ore trade during
the super cycle was mainly linked to the
growth in the steel sector within China. In
more recent years, the growth has reflected
the changed composition of production,
with a considerable increase in Chinese
imports as a result of retired domestic
capacity. This reflects the limitations of
the poor quality (low Fe) iron ore within
China. During 2016, Chinese iron ore production
decreased 9.8 million mt, crude
steel on the other hand only increased by
4.6 million mt, but Chinese imports of
iron ore increased 73 million mt clearly
the stockpiles are growing. The continued
Chinese interest in imported iron ore resulted
in a global export increase by 5.2%
in 2016. World total iron ore exports have
almost doubled since 2006 and amounted
to 1.513 billion mt in 2016 compared to
1.439 billion mt in 2015.
Australia is by far the largest exporter of iron ore with a market share of 54% and the country has been able to profit the most from mine closures in China. During 2016, its exports continued to increase, reaching 814 million mt, an increase of 5.9%. The second largest exporter, Brazil has a market share of 25%. Brazil saw a slightly lower growth in exports, up 2.1% to 374 million mt compared to 2015. South Africa exported 65 million mt of iron ore in 2016, which makes it the third largest exporter. Canada, No. 4, and the Ukraine, No. 5, exported 41 million mt and 37 million mt, respectively, in 2016. Sweden is the sixth largest exporter and shipped some 23 million mt in 2016. Together the five most important iron ore exporting countries accounted for 88% of total exports in 2016, down marginally from 89% in 2015.
Indias exports have dwindled from the 2009 peak of 117 million mt, to a little more than 4 million mt in 2015, however, in 2016, exports increased by more than 400% and reached 22 million mt. The fall was the result of government policies, which have included export taxes on iron ore lumps and fines, including railway tariffs that punishes producers of iron ore for export, bans or caps on production in the states of Karnataka, Goa and Orissa, and actions against illegal mining. In February 2016, the Indian government cut the countrys iron ore export tariffs and eased restrictions, which has led to a surge in mining and more notably exports.
China alone accounts for 69% of total imports. During 2016, the countrys imports of iron ore increased 7.7% following a lower growth of 2% in 2015. With rising imports and falling domestic production, Chinese import dependency has reached even further heights and was 90% in 2016 up from 89% in 2015.
In 2016, the seaborne iron ore trade increased 5.8% to 1.461 billion mt. As in earlier years, the increase was entirely due to higher Chinese imports. For 2017, iron ore shipments for the first nine months of the year from the Pilbara ports in Western Australia have increased by 4.6% compared to the same period last year. Brazilian exports for the period January- August 2017 increased with 5% compared to the same period in 2016. Chinese imports follow this pattern and increased by 4.8% during the period January to September 2017. Chinese imports thus totaled 800 million mt for the first 9 months, or 1.070 billion mt on an annualized rate.
Iron Ore Pellets
Global production of pellets in 2016 fell
sharply to 398 million mt, a decrease of
10% compared to 2015. Exports of pellets
also experienced a decrease and fell
as much as 18%. The reason is related to
the tragic dam failure in Brazil in November
2015. During 2016, the effects of
the capacity reduction in Brazil has taken
its toll on the global pellet market with
lower production, which has led to higher
prices of pellets.
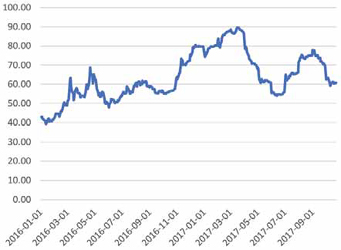
Iron Ore Prices
Last year (2016) started off with an iron
ore price for the most common standard
qualities (as measured by for example the
Platts 62 IODEX index) around $40/mt,
the lowest level since the benchmark prices
were abandoned 2009/2010. During
the early months of 2016, this price improved
substantially, rising to almost $70/
mt in April and reached an annual high in
December 2016, just below $84/mt. The
average price in 2016 was $58/mt.
In 2017, the iron ore price for 62% Fe CFR China grew at the beginning of the year and reached around $90/mt by mid-March. By the end of June, this price had fallen back toward $55/mt only to start growing again with prices up toward $75/mt in late August, early September. Currently, the price has stabilized around $60/mt. With an average iron ore price 62% Fe CFR China of $72/mt so far for 2017, the iron ore market has seen quite a rebound from the $58/mt during 2016 and the $56/mt in 2015.
There are several reasons for this market change, higher than expected steel production and GDP growth in China are certainly important ones. But there are also others with long-term effects, such as the increasing demand for better quality iron ore needed to produce cost-efficient high-quality steel products. Another is the increasing volumes of mid- and low-quality iron ores mined and concomitant relatively lowered supply of high-quality products. These are tendencies observed all over the world, but they are particularly important in China where the need to reduce environmental problems and waste of energy, as well as improve low productivity, which are some of the effects of low-quality ores, is a top priority. This has led to an increased demand for high-quality iron ores with Fe content above 65%. Consequently, the price spread between low quality iron ores (less than 58% Fe) and the 62% Fe standard product on the one hand and high quality (greater than 65% Fe) and the 62% Fe standard have increased. The discount for 58% Fe iron ore price and the 62% Fe iron ore was around $30/mt at the end of 2016 compared to $8/mt early in the year. The premium paid for qualities above 65% Fe has gradually increased during the last couple of years. It is substantial, in some periods it has been reaching 50% on top of the 62% Fe index price.
The development of three distinctly different markets for iron ores, below 58% Fe, around 62% Fe and one for highest quality products (above 65% Fe) seems to be well under way. It will be more important to clarify which quality is being referred to, when giving an iron ore price in the future. It is also important to consider whereto the iron ore is sold as the index includes transport to China and hence if there is a shorter transport involved the price paid will be affected.
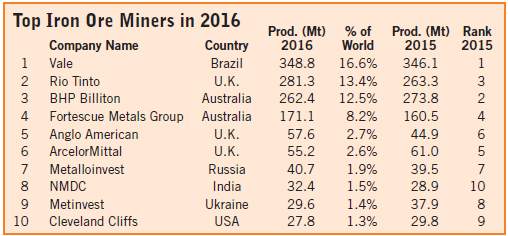
Since then, industry concentration has increased steadily, and in 2016, the 10 largest producers accounted for 62.3% of total production (61.8% in 2015). The Big 3 iron ore mining companies (Vale, BHP and Rio Tinto) have also steadily increased their control over total world iron ore production from 42.1% in 2015 to 42.6% in 2016.
Vale, the Brazilian mining company, remains the worlds largest iron ore producer, with 349 million mt of iron ore production in 2016, up from 346 million mt in 2015, a new all-time high. All of Vales mines are located in Brazil and its market share rose from 16.5% in 2015 to 16.6% in 2016. This is down from its peak share of 18.8% in 2007. Rio Tinto has been the third largest producer since 2013, when it was overtaken by BHP Billiton (now BHP). However, in 2016, Rio regained second place. It produced 281.3 million mt in 2016 and thus controls a market share of 13.4%. Rio Tinto has most of its mines in the Pilbara region in Western Australia, and in addition controls the Iron Ore Co. of Canada (IOC) with mines in Labrador. BHP slipped down to a market share of 12.5% in 2016 (13.1% in 2015). BHPs controlled production in 2016 was 262 million mt compared to 274 million mt in 2015. The production stop at Samarco due to the dam failure catastrophe, is the sole reason for this. Except for the Samarco joint venture with Vale in Brazil, all of BHPs mines are in Western Australia.
However, the measurement of corporate control at the production stage underestimates the real concentration of the iron ore sector, especially by the three largest companies. Large portions of total output do not enter the market, but are produced at captive mines or mines which have a protected or restricted market. The corporate concentration if measured by the share of the major companies in global seaborne trade, is considerably higher. Vale alone controls almost 24% of the total world market for seaborne iron ore trade, and the three largest companies in 2016 controlled 61.1%, a decrease from 64.4% in 2015.
Corporate concentration will likely continue to increase in the current low-price environment. As most unprofitable mines have already closed, further increases of concentration will depend on the continued expansion plans of the Big 3 and possibly the Australian miner Roy Hill controlled by Hancock Prospecting Pty Ltd.
Project Pipeline
In 2016, global production of iron ore
rose by 80 million mt. Most of this tonnage
came from Australia and Brazil
where large-scale project ramp-ups took
place. But there was also signs of increased
production elsewhere because of
rising iron ore prices. In India, the relaxed
export restrictions for iron ore led to the
reopening of mines and production grew.
UNCTAD, in its report The Iron Ore Market 2017, forecasts the annual supply to grow by a little less than 200 million mt between the years 2017-2020. Further, the Big 3, could add as much as 60 million mt in capacity during 2017.
Vale is continuing its ramp up of production at the S11D mine in the Carajas. The final capacity is projected to be 90 million mt/y to be achieved by 2020. By the end of 2017, capacity is estimated to be 22.5 million mt/y. Other than that, Vale is expected to focus on other metals in the near-term future.
BHP continues to develop the South Flank Mines, which will sustain production levels of the company. The mine that could start production sometime after 2020 has seen revisions of its costs as estimates are being shifted upward.
Roy Hill is continuing the development of its 50-million-mt/y iron ore mine in Australia. Fortescue Metals Group, the fourth largest iron ore producer, has communicated that the company will slow growth and focus on production.
Market Outlook
Global GDP growth in 2016 was lower than
expected at the start of the year. This is partly
due to the Brexit vote in the U.K., but also
uncertainties related to the U.S. policies
and a lower than expected growth in many
developing countries. However, according
to the IMF October 2017 World Economic
Outlook, the global upswing in economic
activity is strengthening, with global growth
projected to rise to 3.6% in 2017 and 3.7%
in 2018. This includes broad-based upward
revisions in the euro area, Japan emerging
Asia, other Europe, and Russia, which more
than offsets downward revisions for the U.S.
and the U.K. In China, healthy GDP growth
is expected at 6.8% in 2017.
During 2016, world crude steel production increased by 0.6% or 9.6 million mt. For the first nine months of 2017, growth was 67 million mt, up 5.6% compared to the same period last year. This points toward industry growth. China alone accounts for half of the crude steel production globally, which has grown by 6.3% in the first nine months of 2017 compared to the same period 2016.
The World Steel Associations Short Range Outlook October 2017 for world steel use, anticipates an increase in world steel demand by 2.8% in 2017, followed by an increase of 1.6% in 2018. Chinas steel demand is expected to increase in 2017 by 3% and be flat in 2018. However, this represents a turnaround from the April 2017 predictions of steel consumption in China for 2017 at zero growth and for 2018 a contraction of 2%.
The growth in world steel production came to a halt in 2015. Even if 2016 showed some growth the fast growth period 2000-2010 seems to be over. The decisive factor for steel market prospects are the direction of economic change in China. It is not the slowdown in Chinese growth per se that would lead the slower steel demand growth over the longer term, but rather the reduced share of investment in Chinese GDP.
With lower steel growth, the scrap ratio of the steel burden will also increase as more and more steel becomes available for recycling. This will limit the demand growth for virgin units of iron ore. Thus, pig iron production can arguably give a more accurate picture of the demand for iron ore than crude steel. In 2016, pig iron production increased by 0.1% or 1.1 million mt. That would generate an additional demand of roughly 1.8 million mt iron ore in China. However, global iron ore production increased by 80 million mt in 2016. Clearly more iron ore is produced than what is demanded, but paradoxically iron ore prices increased during the year. This can, as discussed above, at least partly be explained by the increasing price premium for high-quality iron ores and an increasing spread between the various qualities.
With the completion and ramp-up of Vales S11D and the independent Roy Hill mine, iron ore capacity will probably increase more than demand also in the next couple of years. However, Vale has flagged that capacities might not be taken into use if the market cannot support more material. But this will all the same probably result in a weaker 62% Fe iron ore price in 2018, if the other major producers do not follow suit and also lower their production.
The spread of prices between the low, medium and high-quality iron ores are expected to remain wide. There seems to be a glut of low-quality ores and a deficit of high-quality iron ore products. If this situation continues, a reduction of production by certain low-quality miners might take place while other producers of high-quality ores might increase their production.
Anton Löf is an independent consultant based in Stockholm, Sweden. Magnus Ericsson is consulting professor at Luleå University of Technology, Sweden. For further details, contact Anton Löf at anton.j.lof@gmail.com. UNCTADs Iron Ore Market 2017 is now available. For more information, contact: ironore1@unctad.org.