Peak Gold? Top 10 Gold Miners
Process More Ore, Produce Less Gold
Despite higher prices and lower costs, worlds top producers scramble to get out of
debt as output falls
By Jesse Morton, Technical Writer
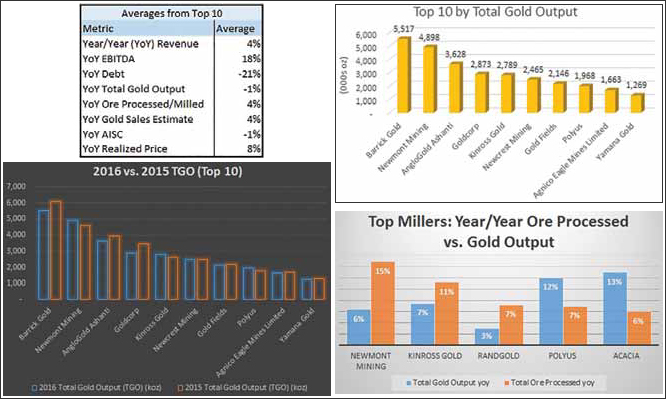
Total Gold Output Down
Total gold output from the top 10 producers1
fell by an average of 1% year over year
(yoy). If Polyus is removed, which upped
their output by 12% yoy, average total gold
output for the remaining nine falls 3% yoy.
For the top five, output fell 4% yoy, while
total ore processed increased 3% yoy.
Based on their statements, such results
were in line with company goals and forecasts.
Top producer Barrick Gold reported
that it exceeded the companys key targets
for the year. It processed 2% less
gold yoy, but total gold output fell 10%
yoy. Goldcorp reported that full year 2016
gold production guidance was achieved.
The company processed 12% less ore yoy,
but total gold output fell 17% yoy. At AngloGold
Ashanti, total gold output fell 8%
yoy, even though the company processed
5% more ore yoy. The company reported
production of 3.6 million ounces (oz) was
within the original guidance for the year.
Breaking from the trend were Newmont, Kinross, and, as mentioned, Polyus. Newmont processed 15% more ore yoy and saw an increase in total gold output of 6%. Kinross processed 11% more ore yoy and raised output by 7% yoy.
Polyus stands alone in the top 10 as it raised output by 12% yoy, but only processed 7% more ore yoy. It also stands alone in that it increased its volume of ore mined by 35% yoy to 29.7 million tons. Forgive the repetition, but lets summarize for clarity. Consider this, of the top 10 producers, six had negative yoy total gold output. One of the top 10 had no change yoy. Therefore, seven of the top 10 producers had either negative or no growth in total gold output. However, on average those seven processed roughly the same amount of ore yoy, while total ore mined fell 2%.
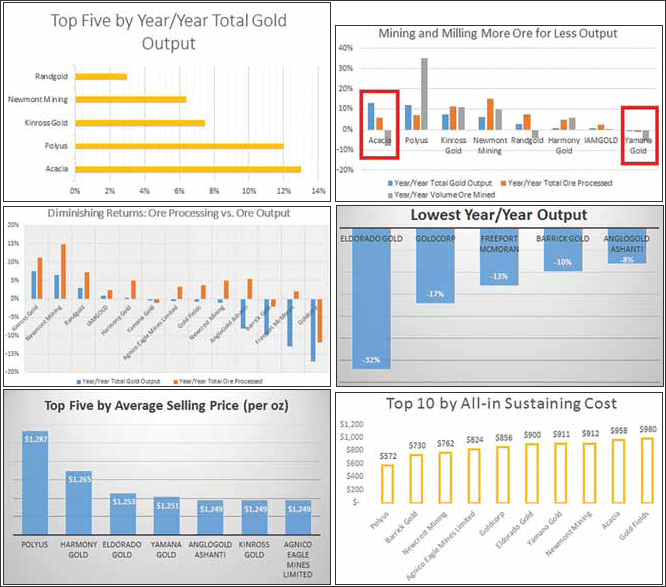
The trend extends to at least what could be considered the next five top producers. For the top 15, on average there was a 1% decrease in gold output yoy, however, there was a 3% increase yoy in total ore mined and a 4% increase yoy in total ore processed. Of the top 15 producers, the only other one with results similar to Polyus is Acacia. It processed 6% more ore yoy, but raised output by 13%. At Yamana Gold, yoy total ore processed fell by 1%, while output did not change (0%) yoy. If you remove Polyus and Acacia from the top 15, average total gold output for the remaining 13 fell by 2% yoy while total ore mined rose by 1% yoy, and total ore processed rose by 3% yoy.
Obviously, some crucial questions arise. Have 13 out of the worlds top 15 gold producers hit the point of diminishing returns at their existing mines? Some of those mines will be discussed momentarily, but first lets look at some of the other metrics for context.
Prices Up, Costs Down
Falling output occurred amid rising prices
and lowered costs. The top 15 miners saw
realized prices rise on average 8% yoy. The
range runs from Freeport-McMoRans average
selling price (ASP) increase of 10% yoy
to Polyus increase of 5%. The ASP for the
top 10 was $1,251. Eliminate Polyus and
the ASP for the remaining nine is $1,247.
All-in sustaining costs (AISC) for the top five fell 2% on average. Pan out to the top 10 and AISC falls an average of 1%. Pan out further, and the average AISC yoy for the top 15 is unchanged (0%). The range runs from Acacias 14% yoy increase to Barricks decrease of 12%, with the median at 0%. Polyus reported the lowest AISC at $572 per oz, a decline of 4% yoy. Harmony had the highest at $1,069/oz, a decline of 6% yoy. Randgold and Freeport- McMoRan did not report AISC.
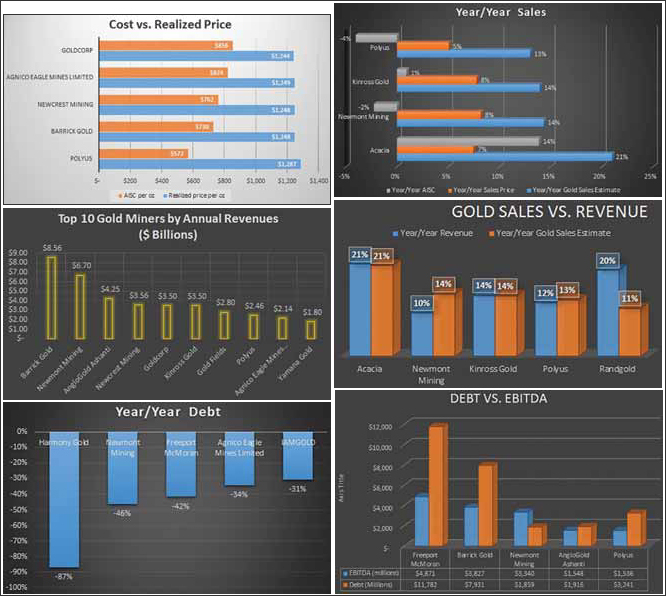
Annual Revenue
The top five producers on average saw no
increase (0%) yoy in revenue. The range
runs from Kinross, which saw a 14% yoy
increase in revenue to $3.5 billion, to Goldcorp,
which saw a 20% drop yoy to the
same. Pan out to the top 10, and the average
yoy revenue increase is 4%. Polyus revenue
increased 12% yoy to $2.46 billion.
Pan out further and the yoy revenue average
increases to 6% thanks to Randgolds yoy
revenue increase of 20% to 1.2 billion and
Acacias increase of 21% to $1.05 billion.
Average annual gold sales estimate (AGSE) for the top five increased 2% yoy. Kinross and Newmont both reported AGSE increased 14% yoy. Goldcorp reported AGSE fell 14% yoy to $3.6 billion. Barrick reported the highest AGSE, at $6.9 billion, which was a decrease of 2% yoy.
For the top 10, AGSE increased 4% yoy. Buoying that number is Polyus, who reported a 13% yoy increase in AGSE to $2.4 billion. For the top 15, AGSE increased on average 6% yoy, with Acacia reporting a yoy AGSE increase of 21% to roughly $1 billion. Of the top 15, four reported a yoy decrease in AGSE. Other than Goldcorp, AGSE fell yoy at titans Freeport-McMo- Ran, Barrick and Anglogold Ashanti. Those companies all saw a decrease yoy in total gold output. They also stood out in another category of metrics, debt elimination, which will be discussed later.
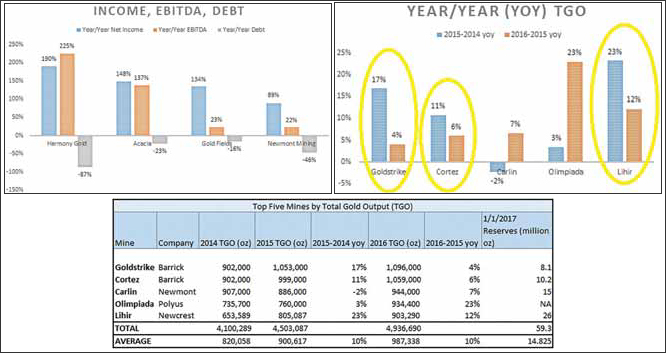
Earnings
Earnings before income tax, depreciation
and amortization (EBITDA) captures raw
earnings, which go beyond simple revenues
from gold sales and can include a
number of other revenues, such as from
the sale of a mine and other similar transactions.
A third of the companies did
not report EBITDA, so meaningful comparisons
are out. Nonetheless, a couple
of the companies reported numbers that
should be duly noted. The EBITDA for the 10 companies that reported increased on
average a staggering 52% yoy. Looking at
the top miners by output, Newmont lead
the top five with a 22% increase in EBITDA
yoy to $3.3 billion. Barrick reported
a 20% increase in EBITDA yoy to $3.8
billion. Outliers are Harmony and Acacia,
with a 225% and 137% increase yoy, respectively.
Remove those outliers and the
average yoy increase in EBITDA for the
remaining seven that reported was 20%.
In other words, raw earnings are up on average a fifth yoy. That, one would think, would increase a companys appetite for debt. One would be wrong.
Debt
In 2016, the worlds top gold producers
strove to eliminate debt. It was an upper
bullet in many reports, that the company
one way or another shed a substantial
amount of debt. For example, the top five
producers dropped an average of 20% of
their debt yoy. Newmont Minings debt reportedly fell 46% yoy. Barrick shed 20%
yoy. For the top 10, average debt fell 21%,
when one discounts Polyus (who tacked
on 900% yoy). Pan out again, and the top
15 on average shed 26% yoy. Other than
Polyus, notable is Harmony Gold, whose
debt fell 87% yoy; Freeport-McMoRan,
whose debt fell 42% yoy; and IAMGOLD,
whose debt dropped 31% yoy. The top
gold miners in the world paid off or otherwise
eliminated on average between a fifth
and a quarter of their debt last year. Of the
top 10, the only one that took on debt was
the one whose yoy total gold output was
greater than its yoy total ore processed.
Start with interest rates. Throughout 2016, interest rates were basically at historic lows globally. As of this writing, the European Union Central Bank still has a key rate of zero, logically dubbed zero percent interest rate policy (ZIRP). Financial journalists and historians have noted that in effect, the world has been experimenting with negative interest rates, or negative interest rate policy (NIRP), for the last half decade, a situation that, some report, is without historic precedent. If ever there was a time to take on debt, it was the last half decade.
This takes it back to earnings. At many of the majors, raw earnings were up, as was revenue, to include revenue from gold sales. Gold prices, too, were up, and AISC was down. So far so good.
As for outlook, that is nebulous, embedded between the lines of dense text in lengthy shareholder reports. It can be inferred with marginal accuracy, which will be explored after the mines.
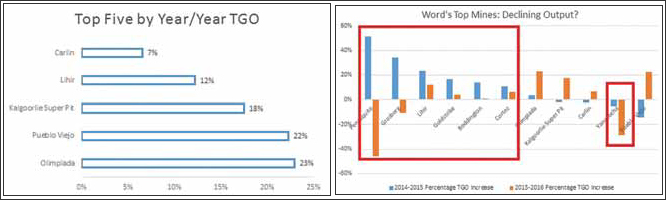
The Mines
The results from the worlds biggest
mines proved to be a microcosm of the
macrocosm. There was notable movement
in the top ranks (by total gold output).
Freeport-McMoRans Grasberg fell
from the three slot, as total gold output
there fell 10% yoy. Newmonts Yanacocha
fell from fourth, as total gold output there
sank 29% yoy. Polyuss Olympiada moved
to fourth and Newcrests Lihir moved to
fifth with yoy total gold output increases
of 23% and 12%, respectively.
Outside the top five, Goldcorps Peñasquito, the sixth ranked gold mine in 2015, saw total gold output fall 46% yoy. Of the top 11, three saw total gold output fall yoy and four saw it rise by single digit percentage points. Of the top 11, only four saw yoy total gold output in 2016 that was greater than the yoy total gold output for 2015. The other seven either saw no increase or an increase that was less than the yoy total gold output increase for 2015.
There are mundane explanations for some of these numbers. For example, at Goldcorps Peñasquito the total ore mined increased 14% yoy. The total ore processed fell by roughly 5%. The stated reason total gold output sank by 46% is lower grade. Goldcorp reported, Peñasquito is expected to produce 410,000 oz of gold (+/-5%) [in 2017]. The decrease compared to 2016 is due to lower grades as the high-grade ore from Phase 5D is expected to be mined by the third quarter of 2017, and more low-grade ore from the stockpiles will be processed during the year. The company added elsewhere, Peñasquito is in the early stages of the productivity and cost optimization efforts(.) The report stated that lower grades will impact total gold output at at least half of Goldcorps mines in 2017. That includes Pueblo Viejo, the worlds seventh biggest mine in 2016 by total gold output, where last year total ore processed increased by almost 9% yoy and total gold output rose 22% yoy.
Evidence and Conviction
Before we close, lets review the evidence.
Item 1: Mining rose. The top 15 goldminers
increased total volume of ore
mined by 3% yoy. The top 10 by 5%.
(When you eliminate Polyus, the increase
for both is 1%.)
Item 2: Milling rose. The biggest goldminers
in the world ramped up ore processing
last year. The top 15 companies
on average processed 4% more ore yoy.
Item 3: Output fell. Seven of the top 10
gold producers in the world saw total
gold output either decrease yoy or move
sideways. On average, the top 10 saw
total output fall 4% yoy.
Item 4: Eight of the top 10 by total output,
and 12 of the top 15, reported diminishing
returns on ore processing.
Eliminating Yamana, who processed
less gold yoy (-1%) for no yoy change in
total gold output (0%), then eight of
the top nine reported diminishing returns
on ore processing, meaning the
yoy total gold output was less than the
yoy total ore processed.
Item 5: At seven of the worlds top 11
producing mines, and at three of the
top five, yoy total gold output increased
at a reduced rate.
Item 6: The majors raced to eliminate
debt. The top five producers shed an average
of 20% of their debt yoy. This in
the face of historically low interest rates, rising ASPs, lowered AISC, higher
raw earnings, and a global economic environment
(fraught with uncertainty
and) favorable to gold.
Item 7: These numbers were accurately
predicted and listed in company forecasts.
The backstory, as hinted earlier, is obviously reduced ore grade. Consider only a couple examples. Barrick wrote that, for 2017, lower grade will impact total output at three of its mines, to include one of its biggest, Cortez, ranked second in the world for output. It also reported shedding 20% of its debt yoy. Newmont reported lower grades at Yanacocha, the fourth largest mine in the world in 2016 by total gold output, and where total gold output fell by 29% yoy. The company also prepped investors for lower grades impacting 2017 numbers at Boddington (ranked seventh), Ahafo, Long Canyon, Twin Peaks, CC&V, Tanami and Kalgoorlie (ranked 11th). Gold Fields reported lower grades hitting numbers at St. Ives, Darlot, Granny Smith and Damang. At St. Ives, total gold output fell 2%, par for the course as the company enterprise-wide processed 4% more ore yoy but saw total gold output fall 1% yoy. And consider what the worlds third largest gold miner by total gold output, AngloGoldAshanti, had to say after total ore processed jumped 5% yoy and total gold output sank 8% yoy: Production was negatively impacted by weaker production from the South African operations largely as a result of safety-related stoppages, lower grades from Kibali, a planned decrease in head grades at Tropicana and Geita, and Obuasi being in care and maintenance for all of 2016. The company sheared off 13% of its debt yoy.
It is said that if something happens once its an accident; twice its a pattern; thrice its a program. The question then becomes what is the program? Answering that is beyond the scope of this article. It could simply be groupthink or peak gold. Bearing in mind that hindsight is 20/20, and giving the majors the benefit of the doubt, perhaps all the companies forged similar plans to mine and process lower grades throughout 2016 back when prices were cascading in the autumn of 2015. This is to say, in boardrooms and skyrise offices, risk aversion is hip now, and that is all there is to this story. (At the close of 2015, for the top 15 by total output, the difference between the ASP [$1,157/oz] and the average AISC [$884/ oz] was $273/oz, or almost 25% of ASP. For 2016, the difference between ASP and AISC was $357/oz, or 30% of ASP.) Were they all running the same market- forecasting software? Or have a majority hit the point of diminishing returns?
One can only speculate, and such speculation brings it back to peak gold production for the majors. E&MJ cannot with conviction declare peak gold for a number of reasons, foremost of which is only a couple of years worth of stats have been assessed. Nonetheless, if the numbers above do not evince peak gold, then they paint a picture of what peak gold will look like when one day that point is reached: Capable, seasoned companies getting less product out of more work, and financially positioning themselves near the exits.