KGHM International and Sumitomo, owners of the recently opened Sierra Gorda mine, plan to increase the mines initial capacity of 120,000 mt/y through a second phase of development that will
bring it up to 220,000 mt/y.
Copper: Building More Capacity
Copper miners are adding new tonnage. What effect will this have on prices,
and will Chinese demand continue to mop up the market?
By Simon Walker, European Editor
KGHM International and Sumitomo, owners of the recently opened Sierra Gorda mine, plan to increase the mines initial capacity of 120,000 mt/y through a second phase of
development that will
bring it up to 220,000 mt/y.
That, of course, is on the micro-scale— with longer-term trends being driven by wider forces. As last year’s copper report (E&MJ, September 2013, pp. 52–60) stated in its introduction, “now that China’s economic growth has slowed...overcapacity is beginning to swing uncomfortably close. In the meantime, copper producers are having to watch their costs carefully, while the pruning of projects that no longer fit properly within portfolios has already begun.”
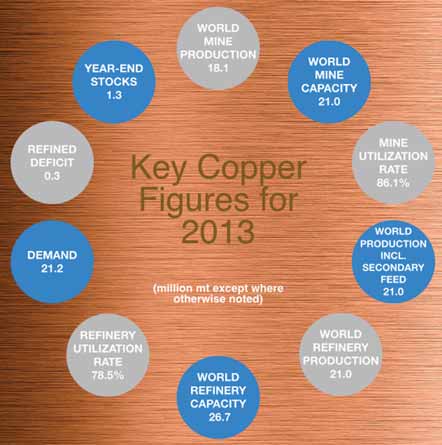
So, have things changed over the past year, and if so, in what direction? In terms of world new-mined copper output, the answer is decidedly positive, with data from the Lisbon-based International Copper Study Group (ICSG) showing that mine output rose by 8% year-on-year from 2012 to 2013. The world’s coppermine operators increased their output by 1.3 million metric tons (mt) to 18 million mt, the ICSG reported, while refined metal production (which includes feed sourced from scrap) rose by 4.5% to 21 million mt.
However, the increase in mine production was strongly biased in favor of concentrates, with output rising by 9% while the tonnage of electro-won copper rose by only 3.5%. This, of course, reflects the long-term trend away from production coming from nearer-surface oxide ore deposits and increasingly being replaced by the deeper sulphide-dominated ores from which concentrates are produced.
In terms of the geographical spread of rising output, the ICSG noted that both Chile and Peru increased production by 6% during 2013, while the U.S. producers achieved a 5% rise. Output rose by 7% in Zambia, with Indonesian production rising by 28%. However, the big achievers in terms of increasing production during the year were the Democratic Republic of Congo (DRC), where reported output went up by 50%, and Mongolia where the ramp-up at Oyu Tolgoi pushed national output up by 61%. Overall, the organization pointed out that three major mines recovered from production constraints that had occurred during 2012, and together accounted for 28% of the worldwide production increase.
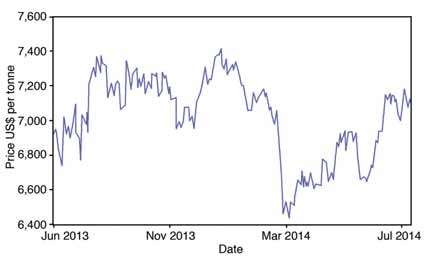
Turning to prices, how have producers and consumers alike fared since mid-2013? As Figure 1 shows, there was a significant range in prices during the 12-month period, with a high of around $7,400 per mt in late 2013 being followed by a near $1,000/mt fall over the next three months. Since then, the trend has been upward, although there have been several “corrections” (for which read “sudden falls”) mixed in.
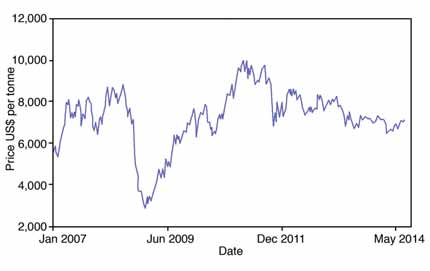
On the other hand, Figure 2 illustrates that world copper producers have had to come to terms with gradually falling prices since mid-2011. At that time, copper was valued at around $10,000/mt, so in reality (and taking inflation into account) the recent rise from $6,400 to the earlyAugust level of $7,000 does not actually represent a great deal to write home about.
As Thomson Reuters GFMS pointed out in the 2014 edition of its Copper Survey, average prices in 2013 were down 8% from the previous year, while taking 2013 in isolation, there was a 9% fall—albeit with even sharper falls in the first half of the year being partly clawed back later on. Negative influences on the price at various stages during the year included weaker Chinese and U.S. economic data, and industry acknowledgement of strong production growth. Prices were boosted, meanwhile—in the short term at least—by events such as the wall collapse at Bingham Canyon, the withdrawal of some smelting capacity in India and Zambia for unplanned maintenance, labor disputes, and the temporary loss of output from the underground operations at Grasberg following the tunnel collapse there.
World Production Drivers
As Table 1 shows, there was no significant
change in the rankings in terms of national copper production between 2012 and
2013. Chile remained top dog by a considerable margin, while in relative terms,
the largest gains came from the DRC,
Indonesia and Zambia.
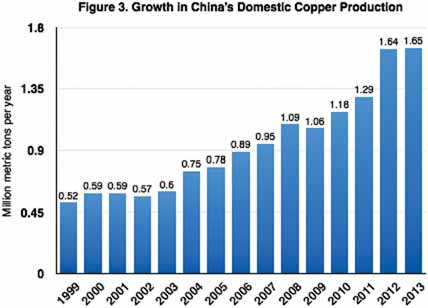
Although the rise in China’s domestic copper production has lagged its overall economic development, the country is now firmly established as the world’s secondlargest supplier—until it is overtaken by Peru, that is. Domestic production has increased for sound economic reasons, given China’s earlier reliance on imported concentrates to feed its massive smelter capacity. Figure 3 shows how Chinese domestic output has risen since the turn of the century, and although the recent data are not wholly comparable to those presented by Thompson Reuters GFMS for 2012 and 2013, the picture presented is clear enough.
Turning to the individual companies that make up the list of major world suppliers, the major change between 2012 and 2013 was the merger between Glencore and Xstrata. The effect was to create a new, larger copper producer that moved up the rankings from the previous year (See Table 2). Indeed, the only top 10 company that actually managed a decline in output year-on-year was Grupo México, through its Southern Copper operations in Mexico and Peru.
Focusing on the big players masks the fact that there are several second-tier producers that also make significant contributions to the annual new-mined total. Companies such as Norilsk Nickel and Kazakhmys, with 2013 production of 370,000 mt and 294,000 mt, respectively, fall into this group, while China’s largest individual copper producer, Jianxi Copper, produced 208,000 mt of copper in concentrates last year. To place that in context, its overall output of cathode, based on both its own and bought feed materials, reached more than 1.12 million mt.
Of course, annual output is one thing; actual installed capacity is another. According to the ICSG, installed capacity at the world’s mines reached 21 million mt at the end of 2013, nearly 1 million mt higher than 12 months before. That meant that the industry was running at 86% capacity utilization, a marked improvement from the 82% reported for 2011, although utilization fell back again somewhat in the first few months of 2014.
On the other hand, world copper refinery utilization, at 78.5% in 2013 based on 26.7 million mt of installed capacity, was lower than that achieved in recent years.
As both the ICSG and GFMS pointed out in their respective reports, questions have recently begun to surface over the accuracy of estimates of copper stocks being held in China. As GFMS noted, there appeared to have been a shifting of stocks to non-exchange locations within China during late 2013 and early 2014. “A key factor leading to this stock shift has been the ongoing demand for copper for financing purposes, which was a significant driver behind the sharp rise in imports into China [at this time],” the company said.
Copper Investing Newscited a Reuters report that China’s copper stocks have been rising, with the State Reserve Bureau having already bought some 200,000 mt during the year. State-held stock levels were then estimated at 650,000–700,000 mt, the report added, noting that the Chinese government plans to increase its copper stocks significantly by 2015.
Reutersalso pointed out that using copper and other metals as financing collateral in China is unregulated, and that the government may try to impose controls. The risk here is that doing so might pump more metal into a market that is already in surplus, thereby pushing down the price.

Market Moves...
In common with recent years, the past
18 months have had their fair share of corporate dealings, albeit mainly involving
either smaller companies or attractive
properties with relatively limited resources. Two exceptions stand out, however: First Quantum’s acquisition of Inmet
Mining, for which its 80% stake in the
Cobre Panama project was the star attraction, and the enforced sale by Glencore
Xstrata of Las Bambas in Peru.
Disposing of Las Bambas was one of the conditions imposed by the Chinese authorities for allowing the merger between Glencore and Xstrata. Completed in July, the sale raised some $7 billion for the company, with the price including reimbursement of capital expenditure and other costs incurred in developing the mine since the start of the year.
For their money, the new owners, a consortium between MMG (62.5%), Guoxin International Investment Corp. (22.5%) and CITIC Metal Co. (15%), acquired a mine that Xstrata had been developing as a 400,000-mt/y copper producer with capex estimated at $5.2 billion and a 2015 startup date. The company had been working on the project since 2004, when it won the rights to it in an asset auction. Subsequent evaluation led to the publication in 2011 of a 1,710-million-mt resource grading 0.6% copper.
First Quantum’s $4.8 billion acquisition of Inmet was finalized in early 2013. By the year-end, the company reported in its annual report that it had “carried out a comprehensive and critical review. Cobre Panama is now being developed as a larger, more robust project with substantially lower capital intensity.
“Its timeframe to construction completion, in the second half of 2017, is realistic for a project of its size and location,” First Quantum went on. “The project is one of the largest and most important private investments in Panama. When in operation, the mine is projected to become the country’s principal exporter, with income similar to that of the Panama Canal.”
Based on measured and indicated resources of 3,271 million mt, Cobre Panama is now being engineered for a capacity of about 70 million mt/y grading 0.5% copper for the first 10 years, with expansion to 100 million mt/y at 0.37% after that. First Quantum now believes that the mine will produce some 320,000 mt/y of copper over a 34-year life, around 20% higher than had been scheduled by Inmet.

...and New Starts
Turn the clock back just over a year, and
the first concentrates started flowing from
Oyu Tolgoi in July 2013. By the end of the
year, the mine had treated 20.3 million mt
of ore and produced 76,700 mt of copper,
plus silver and gold. Nameplate capacity of
the mine is an average 430,000 mt/y of
copper over its life, with Turquoise Hill
Resources predicting an output of
135,000–160,000 mt of copper this year.
In December 2013, Chinalco officially opened its Toromocho mine in Peru, which will have more than 250,000 mt/y output capacity when at full speed. Having already invested $4.8 billion in getting it into production, the company is now evaluating a $1.3 billion expansion for the operation, although production was briefly suspended this year for alleged non-compliance with environmental controls. The operation is now expected to produce between 120,000 and 150,000 mt of copper during 2014, somewhat lower than Chinalco initially stated.
Even more recently, KGHM International and Sumitomo began processing ore at their Sierra Gorda mine in Chile in July. Following an initial capacity of 120,000 mt/y, a second phase of development will bring the mine’s output up to 220,000 mt/y. Sierra Gorda was one of the main incentives for KGHM’s unexpected— and successful—move into the international mining sphere with its acquisition of Quadra FNX Mining in 2011.
Project development has been fasttracked, and has included the construction of a 143-km-long seawater supply pipeline. Drawn from the cooling circuit at the Mejillones power plant, the water is stored in a 750,000-m 3 pond at the mine, equivalent to three days’ usage, with the salt from discharged water being used for dust control at the mine as well.
The first concentrate shipments are expected in September, with half going to Sumitomo for treatment at its smelters, and the remainder being sold on the open market. “With production from Sierra Gorda, the weighted average cost of copper production in the KGHM group will fall,” said Jarosław Romanowski, KGHM’s CFO. “This cost performance will be influenced by sales of Sierra Gorda’s byproduct gold and molybdenum.”
Meanwhile, KGHM began producing ore from its Deep Głogów resource in Poland in April. Expenditure to date on the project has been some $300 million, with the resource now being accessed lying over 250 m deeper than the company’s current operations. Output this year is expected to be around 1 million mt of ore and 14,700 mt of copper, while peak production—which will occur during 2028-2035—will be 200,000– 220,000 mt/y, KGHM predicts.
The mine’s main 1,340-m-deep shaft is due for completion in 2019. “The development of copper orebodies located below 1,200 m is a natural step for KGHM in Poland. The start of production below this level in Deep Głogów is opening a door for us to new high-grade resources,” said KGHM’s president and CEO, Herbert Wirth. “We plan to maintain ore production at around 30 million mt/y, with some 2 million mt/y of concentrate.”
July was also a key month at Pan Pacific Copper’s $4.2 billion Caserones mine in Chile, with the first concentrates shipped and the official opening taking place. Labor and technical issues delayed the start of concentrate production from January until May, although the mine began producing electrowon copper in early 2013. Full capacity of 150,000 mt/y of copper in concentrates is now expected later this year, adding to its 30,000 mt/y of cathode. All the production is being exported to Japan, and will account for around 10% of the country’s concentrate imports.
The Project Pipeline
One thing is certain: copper-mining capacity is still on the rise, and in no small measure. Aside from the new projects noted
above that have already come on stream,
many of the majors have expansion and
development programs under way, some of
which have the potential for substantial
tonnage additions.
For example, Grupo México has spent $60 million on a 10,000-mt/y expansion at Mission, and has a $2.5 billion budget this year covering expansions at Buenavista and Toquepala. The company aims to increase its overall output to 1.335 million mt/y by 2017, with 280,000 mt/y of new capacity at Buenavista and 100,000 mt/y at Toquepala.
Freeport is spending $1.6 billion at Morenci to nearly double output there to 450,000 mt/y by 2015, while expansion at Cerro Verde, scheduled for completion in 2016, will triple the concentrator capacity there to 360,000 mt/d and add 270,000 mt/y of copper output.
Commissioning at First Quantum’s $1.9 billion Sentinel project in Zambia is scheduled for later this year, with a projected output of 270,000–300,000 mt/y of copper. And in Kazakhstan, Kazakhmys has two development projects under way at the moment, Bozshakol and Aktogay, which between them have the potential to add 200,000 mt/y to world copper supplies. Capex is some $4.2 billion between the two. In addition, the company announced in June its $260 million acquisition of the Koksay project, which it is planning as an 80,000-mt/y producer.
At the beginning of August, meanwhile, the Peruvian government gave approval for the environmental plans for Grupo México’s stalled Tia Maria project. Engineered as a 120,000-mt/y producer, the mine should now be on stream by 2017, according to Southern Copper’s CEO, Oscar Gonzalez Rocha, in a recent interview.
Which will, of course, help Peru in its aim of doubling its copper output to 2.8 million mt/y in 2016, a target that was officially confirmed by the country’s minister of energy and mines, Eleodoro Mayorga Alba, during a visit to Cerro Verde in July. Assuming that this happens, Peru will then leapfrog China to become the world’s No. 2 copper supplier.
Rocking the Boat
Nothing is plain sailing in the mining world,
of course, and with copper producers worldwide being faced with challenges such as
price and labor market uncertainties, capex
escalation, and ensuring that social and
environmental compliance commitments
are met, it comes as little comfort when
governments become minded to undertake
“adjustments” to their tax and licensing
regimes. Recent cases in point that have a
direct impact on the copper industry
include both Indonesia and Zambia.
As noted in the August edition of E&MJ (p.4), the impasse over the Indonesian government’s imposition of increased taxes and a future ban on concentrate exports, which began in January, was resolved in late July, at least as far as Freeport was concerned. The government revised its earlier regulations regarding export duties to incorporate reduced rates for copper concentrate exports for companies engaged in smelter development. This applies to Freeport, which is in partnership with PT Antam over the construction of new smelter in the country.
Specific strings to the agreement include higher royalty rates for Freeport, as well as a $115 million assurance bond covering its commitment to the smelter project. However, PT Antam recently raised doubts about the timeframe for completing the smelter, citing its own priority to build new ferronickel-processing facilities.
In Zambia, meanwhile, copper producers are concerned over what they see as a lack of clarity over future taxation policy. Recent government pronouncements have appeared to give conflicting guidance on this, while its withholding of some $600 million in value-added tax repayments is another stumbling block.
In June, First Quantum’s operations director, Matt Pascall, spoke about the company’s decision to slow or postpone some $1 billion in investment until the tax position has been clarified. “There’s a pervading atmosphere that creates a bit of uncertainty,” he was reported as saying. “Certainty is absolutely the critical thing that’s required if we’re going to look at any form of investment.”
In the meantime, the imposition of a 10% tax on exports has led First Quantum to hold stockpile concentrates worth some $350 million at its Kansanshi mine, since the country does not have enough smelting capacity to process them. “Once these issues are resolved the projects will proceed, provided there is certainty in the tax regime,” Pascall said.
With copper producers still committed to their current projects, there is a real risk of overcapacity in the next few years. As GFMS noted in its report, “strong mine production growth is increasingly likely to filter through to higher refined output.
“Consequently, and despite expectations for global demand to continue to grow at above trend levels, we forecast that the market is set to post modest surpluses over the short to medium term. This will act to keep a lid on prices, which we expect to trade within a broad range of $6,000–7,000/mt for much of the remaining part of this year.”
However, what for the longer term? “The lack of investment interest in new mining projects is sowing the seeds of the next supply shortage, and hence the next boom, that will take place merely because there is not enough supply,” Ernst & Young global mining and metals leader, Mike Elliott, was reported as saying earlier this year. “We think in late 2016 the copper shortage will start to bite, and prices are going to have to rise to attract new mine development.
“But that’s not so easy,” he added. “You can’t just turn on the tap.” How true.
 The British Geological Survey’s annual publication World Mineral Productionrepresents the current incarnation of a statistical series that dates back to 1913— indeed, the organization titled the most recent volume, covering 2008-2012, as its Centenary Edition. As part of the celebration of its achievement, the BGS has also posted online the full 100-year series of mineral production publications, with the 402-page book covering 1913 to 1922 being entitled The Mineral Industry of the British Empire and Foreign Countries. As the table shows, one country—the United States—dominated world copper production in 1913, when the data collected by the Mineral Resources Department of the Imperial Institute indicated that the total world output of new-mined copper was 984,000 long tons (just more than 1 million mt). Of this, U.S. producers accounted for 546,600 tons (555,500 mt), representing around 55% of all new-mined copper. Interestingly, the impact of the World War I on copper production was to take U.S. output to more than 850,000 long tons by 1918, while Chilean mines also benefited significantly, reaching an output of 105,100 long tons, but only for production to fall back sharply in 1919 when military demand for copper was slashed. This cutback also affected the U.S., where its mines found markets for just 585,100 long tons of copper that year. By 1921, the situation was even worse, with U.S. production standing at just 208,100 long tons (out of a world total of 531,000 long tons), although demand bounced back considerably the following year as the roaring ‘20s got under way. In terms of exports, the 1913 data-gatherers provided only production statistics for copper, so it was not until figures became available for 1920 that a picture of world trade in copper metal begins to emerge. Again, by far the largest exporter was the U.S., accounting for 246,000 long tons, with other significant providers including Chile, Peru, Australia, Canada and the Belgian Congo (as “rough copper”). Other countries, including Spain, Portugal, Chile and the South West Africa Territory—now Namibia— exported significant tonnages of copper ore, presumably reflecting a surplus of ore production over domestic smelting capacity. Belgium, France, the United Kingdom and Germany were among the principal European copper importers, while the U.S. imported ores and more than 100,000 long tons of metal to offset some of its exports. And in the Far East, both China and Japan were already in the market for copper; a prelude to consumption 100 years later, perhaps? |