Source: All table data provided by Raw Materials Data, Stockholm, Sweden, December 2013.
E&MJ’s Annual Survey of Global Metal-mining Investments
Harsh global economics have dragged investment levels from boom to bust in many
sectors. However, 2014 may be the year the industry touches bottom and begins to
regain economic traction
By Viktoriya Larsson and Magnus Ericsson
Only 95 new projects, with a total projected cost of $38 billion, were registered in Raw Material Group's mines/projects database in 2013. This compares with 113 projects (valued at $47 billion) in 2012 and the peak year of 2010, when 167 projects worth $115 billion were reported. Historically, these figures have proven to be reliable leading indicators of future mining industry capital expenditure.
The rate of decline in new project announcements eased, however, in 2013. This suggests that the slowdown in mining investments will start to bottom-out this year or next. (There has, historically, been a time lag of one or two years.)
In 2010 and 2011, the increase of the total number of projects in the pipeline was around 20% annually, while in 2012 and 2013 the figures were 9% and 8%, respectively. Given the continued growth of metals demand, albeit at a lower pace than a few years ago, the need for continued huge amounts of mining capex is obvious.
The complexity of new projects and the necessity to invest heavily in infrastructure (whether roads, ports or utilities, such as electricity and increasingly, water) will keep average project costs at high levels. The investments necessary to increase mine production by 3%-4% annually from the new, higher level will be higher than that of a 7%-8% production from a lower base tonnage. Accordingly, despite the recent, widely publicized cuts in major companies’ investment budgets, RMG does not expect a return to the low global capex levels of the 1990s and early 2000s.
Most of the cutback in corporate capex has fallen on gold and nickel projects. These include projects on hold, such as Barrick Gold’s Pascua-Lama in Chile (total capex of $8 billion), and Goldcorp and New Gold’s El Morro project, also in Chile (capex of almost $4 billion). Abandoned projects include the Reko Diq venture in Pakistan of Antofagasta and Barrick ($3 billion in capex), Metals X’s Wingellina nickel project in Australia (capex of around $2.3 billion) and, also in Australia, Mitsubishi’s Jack Hills iron-ore project (where all operations have been suspended, and the expansion project was earmarked to cost $4 billion).
However, mining is a cyclical business, and RMG expects investment activity to increase in 2015. Population growth, urbanization and general economic development in the emerging economies are less than the recent experience but remain positive, and so provide a strong base for continued growth in metal demand. In addition, the sharp drop in exploration expenditure in 2013 indicates that too few new deposits will be ready to develop into new mines in five to 10 years.
New Projects: Led by Lead
The fall in metal prices (especially for copper and gold), and the
related slowdown of Chinese consumption, clearly influenced last
year’s mining investment. The only metal that showed a continued
price increase last year was lead (where there is a supply deficit),
and RMG expects this trend to continue for the next few years.
The number of projects announced in the third and fourth
quarters of 2013 was lower than both the first half of the year and
the equivalent period of 2012. However, there is always a delay in
reporting new projects, and this analysis is based only on figures
captured up to early December. Nevertheless, RMG is cautious
about price expectations, and has reduced its investment forecasts
for both the year just ended and the new year.
Project costs have been rising. This trend continued in 2013, and even strengthened. Many of the industry’s largest gold and copper projects reported higher-than-expected capital expenditure. RMG has previously noted that project costs grow when moving from feasibility to the construction phase, and this tendency has continued. In 2013, 13 leading copper projects increased their capex (by a total of $19 billion, 54% above the level of 2012). Gold projects saw an increase of 60% ($7 billion spread among 11 projects).
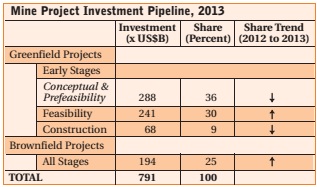
The share size of projects at the feasibility stage increased strongly in 2013, and reached 30% of total investment value. This growth is to be expected given the high numbers of new projects announced in 2010 and 2011 (these projects have matured and passed to the next stage in the project chain). The number of projects at the conceptual and pre-feasibility stages has decreased because of a lack of inflow of new early-stage projects. This reflects declining investment appetite and increasing corporate financial problems. This will likely cause some problems in the future, as there will not be enough projects at the conceptual and prefeasibility stages to satisfy demand.
The share of projects at the construction stage fell 9% in 2013. Investment in these projects also fell, to $68 billion from $82 billion in 2012. The average cost of projects under construction in 2013 amounted to $787 million, which is 15% lower than the average cost in 2012 (and close to the $645 million average of 2011). This is due to several high-cost projects being put on hold (or went into production).
The average cost of “brownfield” projects is generally much lower, and last year averaged $430 million per project. This reflects the advantages of such projects over their “greenfield” equivalent. During the past four years, the share of expansion projects at existing mines has increased, whereas the pipeline share of the restarting of suspended or closed brownfield projects has fallen.
RMG’s statistics focus on projects with a reported investment. RMG removes all projects where there has been no news for eight years. However, the Raw Materials Database (RMD) also includes more than 3,400 projects for which no investment estimates have been given. Most of these projects are at the conceptual stage and cost estimates often cannot be made in such an early phase. The investment total for all mining projects, including also those projects for which no investment estimate has been published, is hence higher than the recorded $791 billion at the end of 2013— but it is difficult to estimate how much bigger.
The metals not covered in this report, but available in RMD, such as bauxite and some of the alloying metals, also demand continuous investments, but at a much lower level and of only marginal importance compared with those covered in the survey.
Given the continued strong metal demand from China, India and other emerging economies, RMG anticipates metal prices to decline a bit further in the first half of 2014 but to pick up again in the second half of 2014 and in 2015.
Many of the early stage projects included in the $791 billion figure will not pass from the conceptual study phase to the construction stage. For example, according to RMG statistics, only around 60% of all iron-ore projects in the pipeline (with a planned start up in the next three years) will materialize (in that period). This statistic for projects that are actually completed on time has declined from the 75–80% level of 10 years ago.
The Big 4 Metals Retain Their Rank
Iron ore, copper, gold and nickel, in that order, are still the most
important investment targets for mining companies.
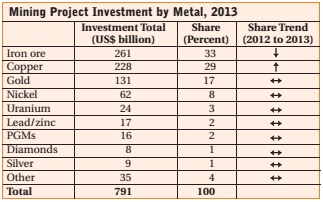
Iron ore has accounted for more than a one-third share each year since 2011, and its related capex amounted to $261 billion in 2013 (33% of the pipeline total, compared with 34% in 2012). In second place, copper projects accounted for 29% of the total pipeline, with an investment value of $228 billion (an increase of $30 billion since 2012). The absolute amount of capital put into copper projects has risen by almost 50% since 2009.
Gold follows, with $131 billion in project investment (giving the metal a 17% share, the level maintained annually for at least five years). Although gold is not the highest ranking metal in terms of project investment, it is, however, ranked highest in terms of the number of new projects reported per year (representing 33% of the total in 2013).
The investment value of nickel projects has not grown since 2009, and the metal saw a fall in its share of the project pipeline last year (accounting for only 8% of the total), with a value of $62 billion. There is a gap, representing some $16–$24 billion, for the investment into projects for uranium, lead-zinc and the PGMs (in that order).
The average iron-ore project costs about $1,240 million, four times more than the average gold project ($303 million). Copper and nickel project costs average $993 million and $792 million, respectively. These numbers were slightly lower in 2012, indicating that projects are becoming more expensive.
In 2013, the growth rate for iron ore and gold again decreased considerably, down from some 13%–14% in 2012 to 4% and 7%, respectively (the growth for iron ore and gold was around 33% in 2011). The growth rate in the gold project pipeline had started to recover in 2011, after a weak year in 2010, with a growth rate of only 11%. New gold projects in 2013 added up to $8 billion compared with $14 billion the year before, which reflects the metal’s price fall.
Iron ore continued its recent rate of growth but at a much slower pace. Only $11 billion was added to the pipeline in 2013, compared with $13 billion during 2012. Copper investment grew by much less in 2013 ($8 billion, compared with $10 billion in 2012 and $24 billion in 2011).
Many gold projects are relatively small in terms of the investment, and the physical number of projects (although still accounting for a high share of the total) has fallen considerably. Only 43 new projects were announced in 2013, compared with 64 projects in 2012. This is not surprising considering the sharply lower gold price last year.
Thirteen new iron-ore projects were announced in 2013, along with six new copper projects (compared with 16 and 21, respectively, in 2012). Overall, gold is still the most popular metal in terms of the number of new projects in 2013, but the number of new nickel projects actually increased in 2013 (after a poor year in 2012), with five new projects at a total investment of $2,300 million. Surprisingly, the interest in silver projects also revived in 2013, with eight new projects (total planned investment of $735 million). Uranium gained six projects, and three new lead-zinc projects were added to the pipeline in 2013.
North American Investment Share Grows
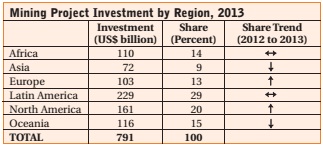
Latin America maintained its top position in 2013, with its share
of the total investment pipeline increasing to 29%. This share is
lower, however, than the 32% recorded in 2010. North America’s
share of the total is growing strongly, up from 15% in 2010 to
20% in 2012 and the same share again last year. In absolute
terms, the continent accounted for $161 billion in 2013, compared with $86 billion in 2010.
Europe, including all of Russia, reached a share of 13% in 2013, compared with 10% in 2012 (gaining an additional $26 billion). Asia reached an investment peak of 14% in 2009 and has fallen since, accounting for only 9% in 2013. Africa’s share of total world investment remained at 14% last year, but the dollar amount increased to $110 billion. The investment pipeline in North America grew by $15 billion in 2013, and fell in Oceania by $5 billion.
The Latin American project pipeline shows the highest projectinvestment average of all regions. This is a result of the large number of mega-projects in the continent. The average investment is $780 million in Latin America, which is more than twice the Asia figure ($340 million). The other regions are in between these two extremes: Europe $563 million, Africa $549 million, North America $740 million and Oceania $572 million.
Russia is in third place, moving from fifth in 2012, with investments of $74 billion, an increase of 53%. The main reason why Russia has increased its ranking is the announcement of three high-cost projects this year. The Oroyek poly-metallic deposit, with a preliminary cost of $5 billion, was announced by the Russian government but has not yet been put up for auction. The Elanskoye nickel deposit, owned by Norilsk Nickel, has around $3.3 billion in capital expenditure, and also includes the Elkinskoye deposit. Intergeo has the $2.3 billion Kingashsky nickel-copper-PGM project. The company is a subsidiary of Onexim Group, owned by Mikhail Prokhorov.
Each of those projects involves base-metal, and particularly nickel, deposits. Most of the projects in Russia are financed by local investors, and the share of funding from abroad is minimal.
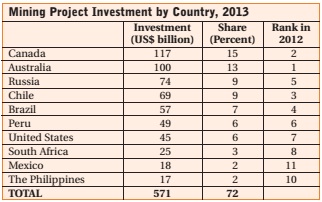
Russia and Mexico saw strong increases (26%), with the latter making it into the top-10 ranking. Peru last year increased its investment by 13% to $49 billion, with Brazil, South Africa and Philippines growing by 8%–10%. The United States also continued to grow but at a slower pace (5% in 2013, compared with 34% in 2012). Countries that weakened in 2013 included Chile, Canada and Guinea (the latter dropping from the list of top countries with a 21% decrease in investment).
Even though Australia fell from top place in terms of the value of its overall investments, it is still the leading country regarding the number of projects in the pipeline. Iron-ore projects in Australia continue to dominate, and account for nine of the top 30 iron-ore projects worldwide, with total investment of $33 billion.
Canada has a much wider mix of projects, including several gold and base metal projects among the global top 20; with five iron-ore projects, 12 gold projects, two copper projects, five nickel projects, four diamond and four uranium projects on the list.
The changed ranking left Canada in top place, pushing Australia out. Russia rose to fifth position, with Chile and Brazil falling. Mexico’s increased investment level moved it to eighth place, exchanging slots with Guinea.
Below the cutoff are Papua New Guinea, Argentina, Guinea, Sierra Leone, Indonesia, Sweden, China, the Democratic Republic of the Congo (DRC), Congo (Brazzaville), Cameroon and Kazakhstan (in that order). Each country has a portfolio of projects amounting to $8–$16 billion.
The investment figure for China is most certainly an underestimate, since many of the projects run by the state-owned companies are never reported in channels that reach the international mining press. With comparable reporting from China there is no doubt that the country would be high among the top 10 countries—although Chinese projects are mostly small, with an average project cost of just $193 million. By comparison, the average cost of a mining project in Canada is $840 million.
Chinese investments, whether in exploration or into new mine projects outside China, are still marginal. It will take years before Chinese companies and China becomes a powerful global player in the mining industry, but it will undoubtedly happen.
|
About This Survey E&MJ’s annual review of metal mining projects is based on the Raw Materials Database, which is researched and published by Stockholm-based Raw Materials Group (RMG), part of the IntierraRMG group (www.intierrarmg.com). The database includes more than 4,700 projects, ranging from those in early stages to those currently under construction. Most of these projects are described in detail, including stage of project, location, resource/reserve figures, metals to be mined and owner of the project. Approximately 1,300 current projects include a more detailed description with planned investment cost and often a planned completion date. This survey includes all major metals (except bauxite and magnesium, which are included in the full database) and diamonds. RMG continues to monitor the rare earths, which have attracted rising political interest. Coal projects are not included but are covered in the RMD Coal database. Eligibility for a full listing requires each project to have an announced investment cost estimate, reserve/resource data and anticipated future production figures available. The comparability of figures from different companies, countries and regions varies—for example, project definition may vary among sources, and some project data may include large infrastructure investments. The information contained in the survey is global in scope; however, complete coverage in some regions or countries, such as China, is difficult to achieve. However, the survey includes mine projects from more than 70 countries, and RMG believes its aggregate figures reflect overall investment trends in the mining industry. For more information, please visit Raw Materials Group on the Web at www.intierrarmg.com or call +46-8-7440065. |