Source: All table data provided by Raw Materials Data, Stockholm,
Sweden, December 2012.
E&MJ’s Annual Survey of Global Mining Investment
Last year’s survey questioned whether the long boom in mining investment was starting to fade, or just experiencing a temporary market adjustment. This year’s verdict: the boom has peaked.
By Magnus Ericsson and Viktoriya Larsson

During 2012, 130 new mining projects with an estimated total cost of $47 billion were registered in Raw Materials Group’s (RMG) Raw Materials Data Metals (RMD Metals) ‘Mines/Projects’ database. Project investment in 2012 was considerably lower than in 2011, when the number of new projects registered was 165 with an esti-mated total investment cost of $110 billion. The final figures for 2012 will most likely increase somewhat as a number of projects from the end of 2012 will only be registered in the database early in 2013. This correction has been as much as 15%–20% in some years, but most probably will be less than that this year. Although it is too early to draw any detailed conclusions it is clear that the peak in investments in the present cycle has been reached and we will most likely see a slight decline in investment activities in 2013. However, this decline will not represent the start of a long-term trend. Mining and mining investments have always been and will remain cyclical businesses, and RMG remains optimistic for the long-term outlook of the sector. Population growth, urbanization and general economic development in the emerging economies are still positive and provide a strong base for continued growth in metal demand and hence the need for increased mine production and for new investment projects.
Economic Weakness, Lower Expectations
As 2012 drew to a close, the total value of announced investment
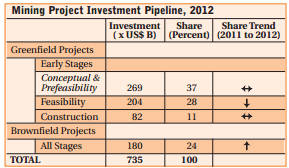
in the project pipeline of the global mining industry was $735 bil-lion, as registered in the RMD Metals ‘Mines/Projects’ database.
The deepening financial crisis in Europe and the slow recovery in
North America seem to have slowed growth in 2012. Metal prices
during the past year have, on the whole, not performed badly, with
gold prices higher than in 2011, copper and iron ore on slightly
lower levels while nickel and zinc have been trending downward
for about two years.
Industry expectations for 2013 are cautious and might have depressed investments toward the end of the past year. The num-ber of projects announced in the third and fourth quarters of 2012 is down compared with both the first half of the year and the same two quarters in 2011. However, it is important to remember: 1) there is always a delay in reporting new projects; and 2) this analysis is based only on figures captured up to late November/ early December.

The upward trend of increased project costs, highlighted in the 2011 survey, continued in 2012. We previously noted that many projects have been enlarged in both announced cost and capacity when moving from the feasibility to the construction phase and this tendency continues. Of all of the gold projects in this year’s list, 10 experienced cost increases totaling more than $8 billion, from an original total of $15.4 billion. The average increase was 54%. Only one project managed to cut its cost, by a marginal 5%. Six projects are new to the list and no comparison is possible.
Project cost increases are not entirely due to increasing unit costs but also to rapid growth in metal demand. Other important cost drivers include more complex ore bodies, deeper lying deposits with lower grades and increasingly remote locations of new mines. Equipment prices and construction costs are increasing and many equipment suppliers are working at near full capacity. Problems caused by lack of experienced mining staff, which disappeared in 2009 and 2010, have re-emerged although not at the same seri-ous level as in late 2007 and early 2008. In some regions— Western Australia, for example—recruitment of staff has become a serious problem and salary and wage levels are getting out of hand.
The number of projects at the feasibility stage has increased strongly, to 28% of total investment. This growth is to be expect-ed given the high numbers of new projects announced in 2010 and 2011, which now have matured and evolved to the next stage in the development process. At the same time, the number of pro-jects at the conceptual and pre-feasibility stages has decreased because of a drop in new, early-stage projects, reflecting the declining investment appetite and increasing financial problems of the junior companies that initiate most of these projects. This will likely cause some problems in the future, as there will not be enough conceptual- or prefeasibility-stage projects in the pipeline to meet the inevitable rising demand for metal.
The share of projects at the construction stage increased mar-ginally compared with 2011. However, the investment value of this sector grew strongly in 2012. The average cost of projects under construction in 2012 was $930 million—a large difference from the average of $645 million in 2011. The same situation is noticeable for brownfield projects, although for those the average project cost is generally much lower, at $450 million, than for a greenfield project.
It is difficult to accurately monitor the progress of brownfield projects from project studies to construction because they are often carried out internally and quickly, without public disclosure. Thus, the total investment figure for projects under construction is un-doubtedly an underestimate, particularly for this project category.
All of this year’s survey statistics are based on projects with an announced investment estimate. The RMD Metals database also includes approximately 1,900 projects—mostly in the conceptual stage—for which no investment figure has been announced. The investment total for all mining projects, including projects for which no investment estimate has been published, is therefore larger than the $735 billion recorded at the end of 2011—but it is difficult to estimate how much larger. If it is assumed that the projects without published investment estimates have a similar cost structure to those projects whose costs are known, the total figure would increase considerably. It could, however, also be argued that unannounced-project costs are lower, as most mega-projects are conducted by public companies that must publicly disclose all significant expenditures. If this is indeed the case, the total figure would be smaller. Projects involving metals not covered in this survey but included in the database also represent a spe-cific investment total but one that is estimated at a much lower level than the major metals represented in the survey
Given the continued strong metal demand from China, India and other emerging economies, RMG expects metal prices to mild-ly decline in 2013 before possibly rising again in 2014.
Many of the early stage projects included in this year’s total investment figure will not pass from the conceptual study phase to the construction stage for a number of reasons. However, histori-cally RMG has observed that 60%–75% of all projects announced will materialize during a three-year period.
Iron Ore Grabs a Bigger Share
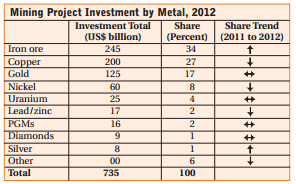
As in previous years iron ore, copper, gold and nickel, in that order,
are the largest investment targets for mining companies. These
four metals account for 86% of the total project pipeline, a small
increase from 84% in 2011. They also dominate the mining busi-ness in terms of total value of its output, which for these metals
only is $606 billion or 71% of the total value of all mine produc-tion of metals during 2011.

Iron ore project investment remains firmly in the top spot, as it has since 2010, and even increased its share in 2012 with a pro-ject pipeline of $245 billion; while copper, in second place, accounted for $200 billion. Gold and nickel are at much lower lev-els ($125 billion and $60 billion respectively), followed by a sig-nificant drop to the $15–$25 billion level where uranium, lead/zinc and the PGMs, in that order, are to be found. The aver-age iron ore project demands an investment of $1.24 billion— more than four times the average investment cost of gold projects, at $304 million—while average copper and nickel project costs are $816 million and $777 million, respectively.
The project growth rate for iron ore and gold both decreased con-siderably in 2012, dropping to 14% and 13%, respectively, from 2011’s rate of 33% and 34%. The growth rate of the gold pipeline had started to recover in 2011 after a weak year in 2010, which had a growth rate of only 11%. New gold projects in 2012 totaled $14 bil-lion compared with $28 billion in 2011 and only $7 billion in 2010. Given gold’s on-going high price, these swings are difficult to explain.
The iron ore sector had only $13 billion of new investment enter the pipeline in 2012 compared with $53 billion in 2011, while copper’s $10 billion of new investment in 2012 fell well below 2011’s $24 billion.
Gold’s per-project investment, on average, is relatively small but the number of gold projects is high. In 2012, 64 new gold projects were announced—not at all surprising considering the record high gold prices of 2012—compared with 53 in 2011. A total of 16 new iron ore projects and 21 new copper projects also were announced in 2012, compared with 21 new iron ore and 24 new copper projects in 2011. It is obvious that copper is the metal that has done best in terms of the number of new projects in 2012.
Somewhat surprisingly the number of new nickel projects increased in 2012 after a downturn in 2011, with six new projects announced at a total investment of $3.7 billion. The rare earths con-tinued to attract interest after a slowdown in 2011 as well: eight new projects at a total of $3.6 billion were announced. If all of them are carried through to construction an over-supply situation will quickly develop. Also unexpected was a revival of interest in silver during 2012, with six new projects at a total announced investment of $1.2 billion. Lead/zinc, uranium and PGMs continued to decline in 2012, with only one, three and two new projects announced, respectively.
Latin America Still No. 1
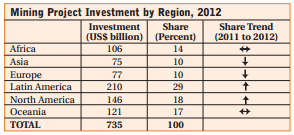
Latin America remained in top position in 2012 with a 29% share
of the global investment pipeline, which is below its highest previ-ous share of 32% in 2010. North America is the only region show-ing strong, continuous growth for the past three years, up from 15%
in 2010 to 20% in 2012, with total investment value rising from
$86 billion in 2010 to $146 billion in 2012. Africa’s share of total
mining project investment was down slightly to 14%, but increased
in value to $106 billion. Europe, including all of Russia, main-tained its position but Asia’s share fell from 11% to 10%; Asia
reached its peak of 14% in 2009 but has been falling since.
The investment pipeline in North America grew by $24 billion in 2012, and in Oceania by $8 billion, a considerably slower pace than the previous year. Latin America’s project pipeline shows the highest average of all because there are more super large projects in this region than in any of the others. The average project invest-ment within the Latin America sector is $730 million, more than twice Asia’s average of $363 million. The other regions fall between these two extremes: Europe, $450 million; Africa, $541 million; North America, $681 million; and Oceania, $583 mil-lion, respectively.
In Europe (excluding Russia), focus is increasingly on the Nordic countries, including Finland, Sweden and Greenland. Sweden has maintained its position among the top 20 countries. Finland is likely to move up the list, as Anglo American has announced that its Sakatti copper/nickel/PGM early-stage project is among the most promising greenfield finds made by the com-pany globally in 20 years. In addition, Gold Fields has revitalized its Arctic platinum project in northern Finland.
The European Commission’s renewed interest in the mining sec-tor has not resulted in any notable improvements in Europe’s invest-ment climate, despite the Raw Materials Initiative having been in place for several years. In Africa, the African Union has decided to establish the Africa Mineral Development Center in Addis Ababa, the capital city of Ethiopia, to support the implementation of the African Mining Vision. The World Bank has announced plans to spend $1 billion on mapping and exploration for metals and miner-als in Africa, which would give this underexplored region a boost. Asia’s problems are clearly highlighted by the continuing uncertain-ty surrounding Mongolia’s Oyu Tolgoi copper project, which has been delayed several times due to the government’s on-going insis-tence on renegotiating the project’s mine agreement.

Investors Wary of Resource Nationalism, Unstable Environments
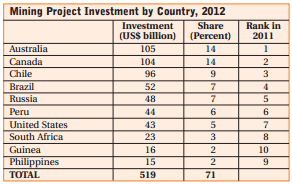
The total investment pipeline share of the 10 most attractive
countries was static in 2012 at 71%, identical to 2011. Australia
and Canada continue to dominate both in terms of capex volumes
and number of projects. Together, they account for more than
$200 billion, divided among 326 projects.
Although the promise of “spreading mining investments more evenly across the globe” has been mentioned in the previous three project surveys, it has become clear that only a small number of countries continue to attract the largest share of the investments. The growing trend of resource nationalism is most certainly a key reason for this trend. Countries that are perceived as offering a sta-ble political and economic environment receive growing attention. The United States has improved its share at a faster rate than any other country between 2010 and 2011, garnering a 38% share in 2011 and 34% in 2012. Chile is another example, with growth during 2011 and 2012 at 20% and 27%, respectively. Australia, Canada and the U.S accounted for 34% of the total project pipeline at the end of 2011. In December 2012, their combined share remained at the same level despite a slight decline by Australia, which was compensated by strong U.S. growth.
Australia has kept its standing as one of the most attractive countries for mining investments despite concerns anticipated by the introduction of its ”super profit” tax, the final promulgated ver-sion of which was a much weaker version of the original proposal. Iron ore projects continue to dominate, and of the top 20 projects in Australia 15 are in iron ore and all of them demand investments of over $1 billion each. Second-ranked Canada has a much broad-er mix of projects including several gold and base metal projects among the top 20 with seven iron ore projects as well as six gold projects, two copper projects, two nickel projects, one diamond project and one niobium project on the list. The pipeline value of projects in both countries is more than $100 billion.
There was little change in ranking of the Top 10 countries in 2012; in fact, the only change was Guinea moving up from ninth position from tenth, replacing the Philippines. Brazil’s mining investment total, which fell in 2011, rebounded in 2012 to its 2010 ranking with more than $50 billion in project funding. Russia, at 5% grew its investment share at a slower pace than most of the Top 10 countries, and the volume of investments in the South African pipeline declined by 7% or $23 billion, under-scoring the problems the country has experienced during past years; calls from the ruling ANC party’s Youth League for national-ization of the mining sector have had an impact on international investors’ perception of the country. Meanwhile, Guinea continued its upward progress despite a slight drop in the $16 billion invest-ment total for its three giant iron ore projects.
Below the Top 10 cutoff are Mexico, Papua New Guinea, Sierra Leone, Argentina, Indonesia, China, Sweden, Republic of the Congo, Cameroon and Kazakhstan in that order, each with a portfolio of pro-jects between $8–$15 billion. (Please note that an error in the 2012 project survey text made incorrect reference in this context to the Democratic Republic of the Congo (DR Congo) instead of Republic of the Congo). The giant Zanaga iron ore project has propelled this Central African country to such a high ranking, an example of how just the start or completion of one large project can significantly alter the ranking of smaller countries relative to others in the survey.
In Sierra Leone, for example, one new project during 2012 added more than $6 billion to its country total, illustrating that not a lot of importance should be associated with a country’s rank out-side the top 10. The investment figure for China, it should be noted, is most certainly an underestimate since many of the pro-jects run by state-owned companies are never reported in such a way that they reach the international mining press. Chinese pro-jects are generally lower in project value at an average cost of $181 million; while in Canada, for example, the average project cost is $775 million.
Chinese mining investment activity outside China remains most-ly marginal. China’s scramble for resources in Australia, Africa and elsewhere involves minimal investment values despite rapid growth in recent years—but it is growth from an almost ‘zero’ starting posi-tion. It will take years before Chinese companies become powerful global players in the mining industry, but it will eventually happen.
Magnus Ericsson is CEO and a director of Raw Materials Group and a profesor at Sweden’s Luleå University of Technology. Viktoriya Larsson is a research analyst at RMG.
| About This Survey E&MJ’s annual review of metal mining projects is compiled from Raw Materials Group’s Raw Materials Projects database (see demo at www.rmg.se). The full database is available from RMG on an annual sub-scription basis and includes more than 4,400 projects as of December 2012, ranging from those in the prefeasibility stage to those currently under construction. Of the total number of projects listed in the database, more than 1,300 include detailed descriptions of resources/reserves, grades, planned investment cost, and completion date. This survey includes all countries with known projects. In the process chain from ore to metal, its main focus is on the mining stage. Pure smelter projects are not listed. In some cases, however, where the process is fully integrated from mining to refining, such as acid pressure leach hydromet-allurgical nickel projects, all stages are included. Eligibility for a full listing requires each project to have an announced investment cost estimate, reserve/resource data and an estimated annual pro-duction figure. Comparability of information from different companies, coun-tries and regions varies, as specific project information or definition may be unclear for various reasons, or the project may also involve large unreported infrastructure costs. Raw Materials Group attempts to resolve these factors, but cannot rectify all discrepancies arising from definitions and comparability. Information contained in the survey is global in scope. However, it should be noted that completely accurate coverage of some regions is dif-ficult to attain due to lack of information or corporate reporting standards and requirements. In total, mine projects are included from more than 70 countries and the survey’s aggregate figures are considered to reflect over-all investment trends in the mining industry reasonably accurately. For more information, visit www.rmg.se or call +46-8-7440065. |
