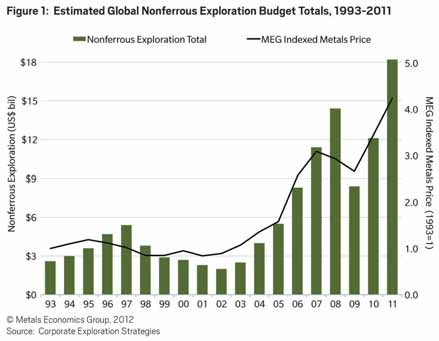
Figure 1—Estimated global nonferrous exploration budget totals, 1993-2011.
Nonferrous Exploration Doubles in Two Years
Figure 1 shows MEG’s estimate of annual nonferrous exploration allocations since the early 1990s relative to a weight-ed metals price index. The graph indicates the cyclical nature of exploration invest-ment and the correlation between metals price trends and exploration spending. From the bottom of the cycle in 2002, the steep rise in metals prices led to succes-sive budget increases by the majors and meteoric budget increases by the juniors, pushing the industry’s exploration total to a new high of $14.4 billion in 2008—an increase of 620% from 2002
. The boom years came to an abrupt halt in September 2008 as the world fell into the worst economic downturn in decades. Widespread forecasts of a deep and protracted global recession painted a grim outlook for near-term global com-modities demand, pushed most metals prices into steep decline, and forced the great majority of companies to slash their 2009 exploration plans. The resulting $6 billion (42%) drop in exploration spend-ing from 2008’s high was the largest year-on-year decline (in both dollar and percentage terms) since MEG began the CES in 1989.
For more information, contact: www.metaleconomics.com.