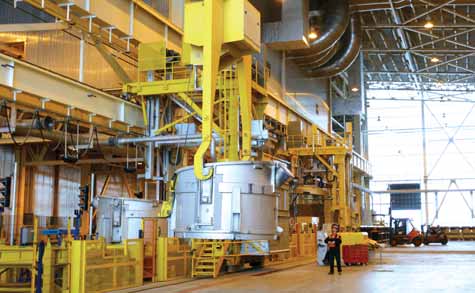
One of the most modern in the world, the casthouse at Alcoa’s Fjarðaál smelter in Iceland was commissioned in
2008 with a capacity of 346,000 mt/y. (Photo courtesy of Alcoa)
Aluminum: Smelters Struggle as Prices Fall
E&MJ looks at an industry facing major structural issue
By Simon Walker, European Editor
Perhaps the more telling difference, however, is the utilization factor for installed capacity. According to Inter-national Copper Study Group figures, in 2010 the world’s mines produced 16.1 million mt of copper against installed capacity of 19.9 million mt, representing around 80% capacity utilization. For alu-minum, the USGS estimated production of 40.8 million mt compared with 53.5 million mt of capacity, or 76% utiliza-tion, a figure unlikely to make pleasant reading to corporate CFOs.
Indeed, with LME prices having drift-ed steadily for most of 2011 while ware-house stocks remain stubbornly high, on the face of it there can be little incentive for producers to invest in new capacity, given the high costs involved in estab-lishing not only the smelter but also the power supply needed to run it.
Having painted this fairly gloomy pic-ture to start with, in point of fact the alu-minum industry is going through a num-ber of significant changes, not least of which is the emergence of new, lower-cost smelting capacity in parts of the world that hitherto have played no part in aluminum production.
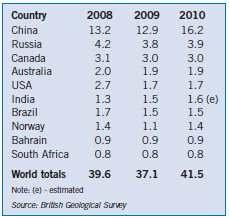
Table 1—Leading world primary aluminum producer
countries, 2008-2010 (million mt).
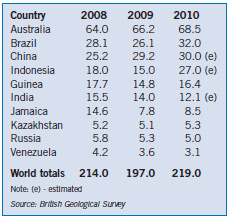
Table 2—Leading world bauxite producer countries,
2008-2010 (million mt).
The top 10 countries, as listed in Table 1, accounted for around 33% of world production in 2010. As with other commodities, there has been striking growth in China’s production over the past decade, rising from about 3 million mt in 2000 (less than both the U.S. and Russia) to 16.2 million mt in 2010. What is also clear from these figures is the impact the world economic recession had on demand in 2009, even in China, and the rebound that has taken place since then. For 2011, the International Aluminium Institute reported world pro-duction of 44.3 million mt, compared with a figure of 41.2 million mt for 2010, which compares favorably with the statistics compiled by the BGS.
The main difference in terms of the geographical distribution of aluminum production over the 10-year period has been the emergence of energy-rich coun-tries such as Iceland, the United Arab Emirates, Bahrain, Oman and Mozam-bique as aluminum producers, all of which have consolidated their positions as major suppliers to the world market. Conversely, some other African countries, together with the U.S., have struggled to maintain their capability to supply into growing demand, with the general trend being one of new, lower-cost capacity replacing older smelters that can no longer compete on world-wide terms.
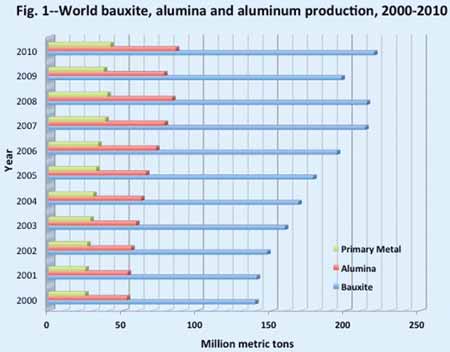
Smelter capacity is just one aspect of aluminum production, of course, with smelters wholly dependent on the supply of bauxite and alumina, often from dif-ferent parts of the world. Tables 2 and 3 provide a breakdown of the major nation-al suppliers of both commodities, with Australia leading the pack convincingly in terms of bauxite production, and China topping the alumina-production league, based on both domestically produced and imported bauxite. Figure 1 shows the production trends for bauxite, alumina and primary aluminum between 2000 and 2010.
What Tables 2 and 3 also show is a degree of disconnect between bauxite mining and alumina production, with countries such as the U.S and Ireland relying completely on imported bauxite for refining, while Indonesia and Guinea, for example, are predominantly bauxite exporters with only limited capability for adding value before export.
When it comes to the leading alu-minum-producing companies, Table 4 shows how relatively few big players have a tight hold on a large proportion of world output. The figures relate to 2010 production, since when Norway’s Hydro will have increased its capability— although not its ranking—following its acquisition of Vale’s primary aluminum interests last year.
The principal companies missing from this list include Anglo American, which has traditionally focused on other commodities, and Xstrata, which divest-ed the aluminum assets it acquired when it bought Falconbridge. However, should the proposed merger take place between Xstrata and Glencore, the new company will once again have aluminum smelting interests. It will be educational to see whether these are retained to form the basis of a new division within the company, which would infer further acquisitions to make it competitively viable, or whether ‘Glenstrata’ chooses to divest again and leave the field to other companies.
Another factor to consider in the sup-ply and demand equation is recycling, with aluminum one of the most widely recycled metals. According to the Norwegian producer, Hydro, around 10.6 million mt of aluminum were recycled during 2010, taking total supply to more than 52 million mt.
A Look at the Markets
Figure 2 illustrates LME price trends for
three-months aluminum metal over the
period from January 2011 to February
2012. At first glance, the chart appears
relatively stable, but the reality is some-what different. During this period, the
price reached a peak of $2,772/mt in
late April 2011 and a trough of
$1,974/mt in mid-December—repre-senting a drop of nearly 29% over eight
months. Little wonder, then, that by the
end of the year a number of companies
had announced cutbacks in output,
although the price had begun to gain a
little as the market entered the new year.
Turning to LME stocks, Figures 3 and 4 show how these have developed over the past year, and over the past five years respectively. Looking at the one-year trend first, the most noticeable feature was the sudden influx of stock that occurred during December, when more than 40,000 mt of metal was added to the LME warehouse inventory. This took the total to more than 5 million mt, a level that represents around one-tenth of annual supply. It has to be remembered as well that the LME is by no means the only holder of aluminum in stock: producers, consumers, the Shanghai Futures Exhange and other bodies, with Hydro estimating that total stocks— declared and undeclared—may well be closer to 11 million mt.
However, it is the five-year stock graph (Figure 4) that clearly shows to how the situation developed. Up to third-quarter 2008, LME stocks—which com-prise by far the largest single component of the world total—had grown gradually from around 700,000 mt to more than 1 million mt over an 18-month period. Put into perspective, that equated to around one week’s supply on the basis of supply in 2010.
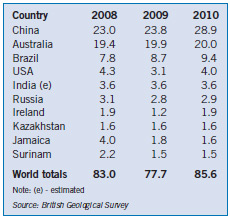
Table 3—Leading world alumina producer countries,
2008-2010 (million mt Al2O3 content).
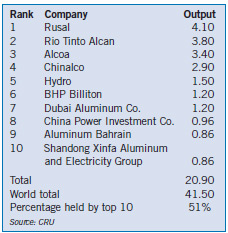
Table 4—Leading primary aluminum-producing
companies, 2010 (million mt).
Under such circumstances, it is hard-ly surprising that a new round of produc-tion cutbacks is now under way as com-panies weed out higher-cost capacity that they perceive will have little long-term viability. Speaking at the presentation of the company’s 2011 results in early February, Rio Tinto’s CEO, Tom Albanese said, “Outside of China, we estimate that approximately 2.5 million mt of smelting capacity is in a loss-making position at current prices and input costs.”
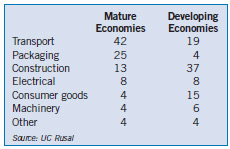
In respect of demand, it is interesting to see the wide variation in sectoral off-take between different parts of the world. Table 5 provides a breakdown of end-user sectors for both industrialized- and devel-oping-economy countries, showing that aluminum use in construction and in the production of consumer goods is higher in the developing world, whereas trans-port and packaging are the dominant end-uses in mature economies.
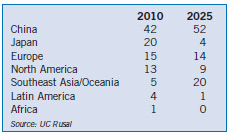
Finally, Table 6 shows United Company Rusal’s predictions for alu-minum consumption, on a 100% basis, for different regions of the world in 2010 and in 2025. While the company expects China to build an even stronger demand base than at present, the real growth area (in percentage terms at least) will be the rest of Southeast Asia, while Japan’s usage will fall significantly. Taken as an indicator of economic progress, Rusal’s projections make grim reading for Latin America, and particularly for Africa, where it expects growth in demand to be minimal in real terms and consumption to remain insignificant in relation to over-all demand.
What Rusal’s figures do not show, of course, are the actual quantities involved in making these comparisons. A joint USGS/EPA study presented at an OECD meeting in 2010 estimated world aluminum demand will have grown to 120 million mt/y by 2025 (requiring the production of 570 million mt of bauxite and 230 million mt of alumina), assum-ing an average growth rate of 4.1%. On recent experience, this may or may not be realistic.
Rationalization, Past and Present
Before reviewing the state of the industry
today, it is perhaps worth taking a look
back to see how the current major play-ers evolved. For example, Rusal was
formed in 2007 through the merger of
the former OAO Rusal, Sual and some of
Glencore’s alumina-sector operations.
During the late 1990s, Alcoa spent more than $10 billion on buying out other aluminum producers, including Alumax, Reynolds and Cordant, while Alcan’s outlay on takeovers that includ-ed algroup and Pechiney was not much less. The $38-billion takeover of Alcan by Rio Tinto in 2007 led to raised eye-brows at the time, given that it sur-passed Alcoa’s already tabled bid by around $11 billion. This has since come back to haunt Rio Tinto, which took an $8.9-billion charge against its 2011 accounts covering write-downs in its alu-minum business. The company’s CFO, Guy Elliott, said, “Strong currencies in some regions, high raw material costs and rising LME inventory are delaying growth projects for new aluminum capacity and leading to much lower mar-ket values for aluminum assets than a year ago. The combination of these fac-tors has led us to write off $8.9 billion of our aluminum assets in 2011, of which $7.4 billion was goodwill.”
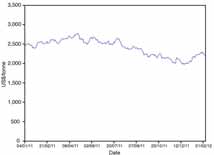
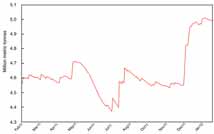
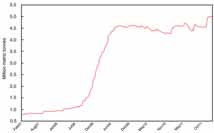
Figure 2—LME Price Trends, 1/2011–2/2012. Figure 3—LME Stocks, 2/2011–1/2012. Figure 4—LME Stocks, 2/2007–10/2011.
Oriel Securities analyst Charles Cooper summarized the situation thus: “The group has finally admitted defeat on Alcan amid low prices and soaring input costs,” he was reported as saying at the time.
Rio Tinto’s write-down came only a few weeks after it had announced a major restructuring of its aluminum business, with a number of its plants in Australia and elsewhere being earmarked for future divestment. On the other side of the coin, the company has confirmed the $2.7 bil-lion needed to complete the moderniza-tion and expansion at its Kitimat smelter in British Columbia. The modernization of Kitimat will transform its performance, moving it from the third quartile to the first decile of the industry cost curve, and cutting greenhouse-gas emissions by about half, according to Jacynthe Côté, Rio Tinto Alcan’s CEO.
And, as Alcoa maintains investment in its integrated mine-refinery-740,000-mt/y-smelter joint venture in Saudi Arabia, it has also announced smelter-capacity cutbacks in the U.S., Italy and Spain, cutting 531,000 mt from its 4.5 million mt/y nameplate capacity—which produced 3.8 million mt in 2011, repre-senting an 84% utilization rate. An uncompetitive energy position, combined with rising raw-material costs and falling aluminum prices, led to the move, the company stated.
Energy Matters
By its very nature, primary aluminum pro-duction depends on the availability of
low-cost energy. The boom in smelter
output from the Middle East reflects this,
while the failure of successive promoters
of the Coega smelter project in South
Africa to move ahead has been largely
down to power-provision issues.
Across the board, aluminum produc-ers are investing heavily in the develop-ment of new, lower-energy technology that will help give them a competitive edge in the market. In November, Alcoa announced a $2.1-billion investment in its Québec smelters that includes replac-ing Söderberg technology at Baie-Comeau with new equipment that will optimize power usage and cut the plant’s emissions by 40%.
Also in Québec, Rio Tinto Alcan is spending over $750 million on the first phase of an AP60 plant at its Saguenay-Lac-Saint-Jean smelter, with the aim of achieving a 40% increase in metal out-put per pot.
The cutting edge of smelting tech-nology came under the spotlight during the 10 th Australasian Aluminum Smelting Technology conference, held in Launces-ton, Tasmania, last October. In a keynote presentation, Xiaoling Liu from Rio Tinto Alcan set the scene for the need for innovation. “Input costs for aluminum produc-tion continue to rise across the world put-ting upward pressure on the cost curve,” he said. “Global energy costs are increas-ing as economies develop. In addition, some countries are starting to put cost mechanisms in place to reduce carbon dioxide emissions, which will lead to a source of differentiation between regions in the short-to-medium term. Raw material costs are escalating for all producers, driv-en by a number of the same factors—ener-gy and labor costs, strong currencies—as well as a tightening of the market for com-modities such as anode-grade coke.”
Similarly, Evan Andrews and other authors from Rio Tinto Alcan’s Tomago smelter in New South Wales reported on the introduction there of 240-kA AP24 cell technology which, they said, had resulted in specific energy requirements reduced to 13.3 kWh/kg. Meanwhile, improvements at Aluminerie Alouette in Québec have brought specific energy needs down to 12.7 kWh/kg, other authors noted, with work in hand aimed at reducing this further to 12.5 kWh.
Stability or Insecurity?
Despite the continuing rise in Chinese
demand for aluminum, the large stock
overhang—a considerable proportion of
which is reportedly tied in to the financ-ing for new projects—and falling prices
have led the major producers to start
culling higher-cost capacity. As explained
on p. 42, Rusal estimates that some 3.9
million mt of capacity will be either
closed or suspended this year, exacerbat-ing a situation that already has the indus-try working at less than four-fifths name-plate capacity.
However, Alcoa has predicted that increasing demand, combined with mar-ket-related production cutbacks, will result in the market showing a 600,000-mt deficit in 2012. This will clearly lead to a drawdown on some stocks, although still leaving a substantial tonnage in the LME’s warehouses and elsewhere. Whether this deficit is enough to restrain further price falls or not, remains to be seen.
Outside China, much depends in the short term on general economic condi-tions—whether European demand con-tinues to be subdued as the euro curren-cy crisis either develops or is solved, for instance. Recent positive signals from the manufacturing and housing sectors in the U.S. should form a foundation for new aluminum demand, while U.S. car manufacturers reported higher sales for 2011 than the year before.
What seems to be firming up is a con-tinuing trend toward higher smelter capacities that can optimize energy usage in metal production. Value addi-tion is also becoming more important, not only in conventional terms, but also through smelting higher-value aluminum using lower-value energy, as in the Middle East. While demand growth con-tinues to underpin capacity expansions, the fact that this capacity is still being so under-utilized bodes ill for many older plants around the world, with the high costs of entry into the industry forming a barrier to new entrants unless they have both energy and financing—in plenty.
|
Rusal's Perspective E&MJ asked United Company Rusal for its views on a number of issues facing the world aluminum industry. Here are some of its responses: How does Rusal see the market developing over this year and into 2013? UC Rusal expects that global primary aluminum consumption in 2012 will reach 48.2 million mt (7% growth), with China the largest growing market (11% growth), followed by India (10% growth). Demand in Japan, North America and Latin America will grow by 5% in each area, while consumption growth in Europe will be flat. How much of the world's existing smelter capacity is under threat of permanent closure because it is too high cost to be able to com- pete with new plants? With aluminum prices having fallen in late 2011, a significant proportion of world and European primary alu- minum capacity has become unprofitable. Rusal expects a further 6%–8% of global capacity to be curtailed in the first half of 2012. Known curtailments and disruptions (such as power-supply prob- lems) will result in the loss of 2%–3% of global aluminum supply in 2012, with several global aluminum peers having already announced 1 million mt of aluminum production cuts. Rusal estimates that about 31% of Chinese aluminum pro- duction capacity (5.9 million mt/y) may be unprofitable now, with production costs set to rise as the central government con- tinues its efforts to rein in growth in energy-intensive industries (it raised power tariffs twice in 2011), together with further yuan appreciation. At the same time, low-cost aluminum production in western China may partly replace high-cost production losses. Overall, Rusal is estimating that there will be 2.7 million mt of primary capacity lost during 2012 outside China, plus a fur- ther 1.2 million mt cut in China. This gives a total production loss of around 3.9 million mt, or about 8% of global production. Rusal is monitoring the situation and may cut aluminum output by 6% in the next 18 months. What are Rusal's main growth projects? The company currently has two major projects; BEMO and the Taishet aluminum smelter, both in Siberia. BEMO includes the construction of a hydropower plant on the Angara River and the 588,000-mt/y Boguchansky smelter, while Taishet will produce 750,000 mt/y at full capacity. These two smelters will increase Rusal's capacity in Siberia from 3.5 to 4.8 million mt/y, and demonstrates its ability to bring capacity on stream to respond to market changes. Over 90% of this capacity is low carbon footprint hydro powered and ideally located to support China's growing aluminum consump- tion, which is expected increase from 19 million mt this year to 30 million mt by 2015. With the cost of energy becoming more challenging, what is Rusal doing to make its production more competitive within the world market? Amid growing concern over the global economic instability and rising electricity tariffs, Rusal has continued to implement its long-term strategy of increasing the production of value-added products. In 2011, it launched a two-year, $55- million modernization project covering five smelters in European Russia, aimed at ensuring that all of their output is value-added—such as wire rod, slabs and foundry alloys. The company is also focusing on increasing value-added production at its Siberian smelters, with 88% of its Sayanogorsk smelter's output in 2011 having consisted of high- er-value products. Overall, Rusal plans to increase alloy pro- duction at its Siberian units by up to 70% by 2016, taking pro- duction from 1.13 to 1.93 million mt/y. Looking at smelting technology, what does Rusal envisage being involved in the next generation of smelters, to reduce the ener- gy usage per ton of product? Rusal owns a number of energy- efficient smelter technologies, including RA-300, RA-400 and RA-500, which cut energy consumption, drive down emissions and boost production efficiencies. The company is also working on improving the traditional Söderberg reduction process, and has developed a new generation of cells that use colloidal anode paste instead of traditional paste. This historically con- tained much more pitch, the main source of tar-based emis- sions. The new 'Clean Söderberg' technology reduces environ- mental impacts and boosts the cells' efficiency, and is now being introduced at its largest smelters. Rusal's major innovation project is the development of a ground-breaking inert-anode technology from which the only by- product will be pure oxygen. A single cell, using this technology, will be able to produce the same amount of oxygen as 70 ha of forest. The new technology could be introduced as early as 2015. In addition, Rusal is looking at how to improve the cell structure, with one project in progress to create a unique cell with vertical anodes and another looking at ways of cutting energy consump- tion by reshaping and adding texture to the cell bottom. |