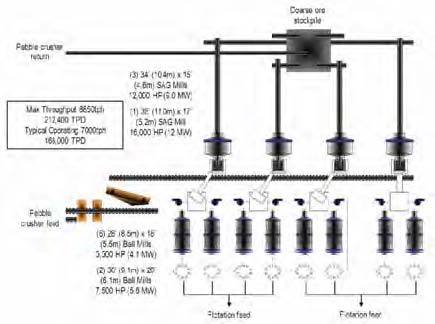
Figure 1—Rio Tinto Copperton Concentrator grind flow sheet.
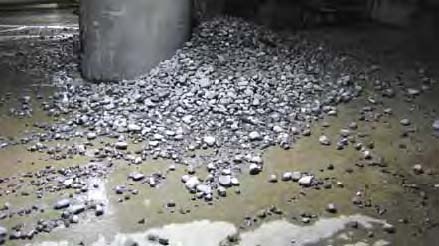
Figure 2—Rock flushed from a rougher row after a significant rock event.
Cyclone Monitoring System Improves Operations at KUC's Copperton Concentrator
New technology allows mill to identify coarse material fouling flotation feed
By Dylan Cirulis and Jerin Russell
Figure 1—Rio Tinto Copperton Concentrator grind flow sheet.
Figure 2—Rock flushed from a rougher row after a significant rock event.
Copperton recently focused on the role of the cyclone battery and how to monitor the performance of each indi-vidual cyclone. Variation in the per-formance of the grinding circuit flows through to the cyclones and in many cases the cyclones will report coarse material to the overflow when not oper-ating as designed. Coarse material in the flotation feed reduces the econom-ic performance of the concentrator through lower valuable mineral recovery and in extreme cases, through blocking of the flow path in the flotation cells.
The existing oversize detection sys-tem is installed on the combined cyclone battery overflow line. Opera-tionally, troubleshooting the cause of oversize is difficult and time consum-ing, resulting in considerable disruption to the flotation circuit before the offending cyclone is taken offline. Copperton and CiDRA recently installed a new technology for monitoring indi-vidual hydrocyclone overflow lines for coarse material discharge.
The Value of Early Detection
The target grind size for flotation feed
at Copperton is 32% +150 microns
(100 mesh). Cyclone product greater
than 150 microns is considered coarse
(or oversize). Particles 6 mm (~0.25
inches) or greater can be considered
"rocks" and a large flow of this materi-al can block the internals of the flota-tion cells, significantly impacting their
performance. Figure 2 shows an exam-ple of the material that has been
flushed from a rougher row after a
severe rock event. Some causes of
"rock" events include: SAG mill grate
or trommel panel failure; cyclone fail-ure, and degradation or failure of SAG
mill pebble removal system.
It is difficult to quantify the eco-nomic impact of large rock events due the widespread impacts and flow on effects across areas. However, qualita-tively the losses are associated with: rougher row downtime (recovery loss through lower residence time), reduced throughput, equipment damage (flota-tion cell internals, slurry pumps, etc.), cleanup costs, and decay in flotation cell performance over time (event not large enough to lead to shut down).
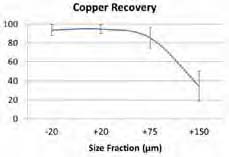
Recovery of liberated and middling +150-micron mineral particles in the flotation circuit is significantly lower than -150-micron particles. Based on mineral liberation analyzer (MLA) data, the long term average +150-micron copper recov-ery is significantly lower compared with recovery of -150-micron particles (See Figure 3). It is also worth noting that the recovery of +150-micron size fraction is considerably more variable than for the -150-micron size fraction.
The value lies in being able to detect a rock event early and optimize cyclone performance to reduce the amount of +150-micron particles in the flotation feed. The new technology aims to provide rock detection and identify cyclone fail-ure and the cyclone(s) producing rocks.
One of CiDRA Mineral Processing's core competencies is the measurement of acoustic information through the wall of a pipe. This technology is not only well suited for monitoring individual cyclones, but is also non-intrusive. The sensor is attached to the external sur-face of the pipe, allowing sensors to be installed and maintained without inter-ruption to the process.
CiDRA's acoustic measurement tech-nology, CYCLONEtrac, provides a novel solution for problems such as rocks reporting to the overflow and unreliable feed isolation valve position (limit switch failures). Additionally, the sys-tem provides the control room with an indication of the operating mode of each cyclone. The system can differen-tiate between a cyclone that is off (feed isolation valve shut), operating normally (fines reporting to overflow and coarse to underflow), or abnormal states such as rocks reporting to the overflow.
Prototype hardware was first installed on a cyclone battery at Copperton to record real-time acoustic data directly to a mass storage device. The data was post processed and used to develop the initial CYCLONEtrac algorithms. Then the new system's per-formance was compared to Copperton's existing oversize material detector installed in the combined overflow of the battery. The detection algorithm was refined and the hardware and soft-ware designs were validated.
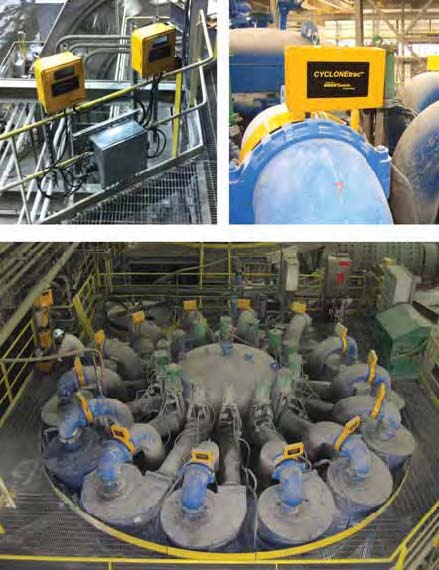
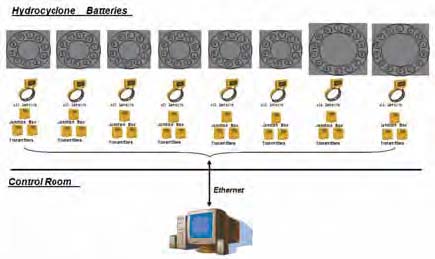
A full system was then built and installed on all eight cyclone batteries in the grind plant. Figure 4 shows the transmitters and junction box for one battery, the CYCLONEtrac band in-stalled on an overflow pipe, and a full battery instrumented with bands.
The system consists of a sensor and preamplifier attached to the external pipe surface on the overflow of each cyclone. A schematic of the system is shown in Figure 5. The preamplifier outputs are connected to transmitters which perform the first level data processing for each battery. The data accumulated by the transmitters is aggregated by a computer in the Copperton control room. This data is used by the CYCLONEtrac system to determine the operational state of each individual cyclone and of each battery of cyclones. In addition to the real-time dis-play, data is stored for local review and transmitted to the CiDRA data center for the generation of daily and weekly per-formance and utilization reports. Both the displayed data and the summary reports facilitate smart maintenance scheduling and aid in troubleshooting to reduce the downtime associated with periodic maintenance and repairs.
System Validation
Throughout the development of the
CYCLONEtrac system, real-time
acoustic data for both normal and
abnormal operating conditions were
recorded, including 15 severe rock
events. One of the events occurred on
February 3, 2009, and is analyzed here
to demonstrate the system response.
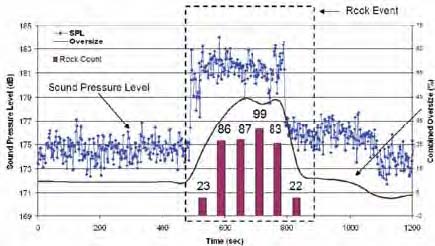
Using the defined system threshold parameters the system successfully detects a sustained rock event. This data was then compared to Copperton's oversized particle detection system data from the data historian. The CYCLONEtrac system detected this event as displayed in Figure 6. The blue trace is the sound pressure level (SPL) calculated by CYCLONEtrac. The blue trace shows that the SPL of the acoustic signal for hydrocyclone No. 3 increases more than 6 dB during the event. The overlaid maroon bars repre-sent the number of impacts detected by CYCLONEtrac for each minute of the event (from rocks striking the inner pipe wall), as defined by the algorithm.
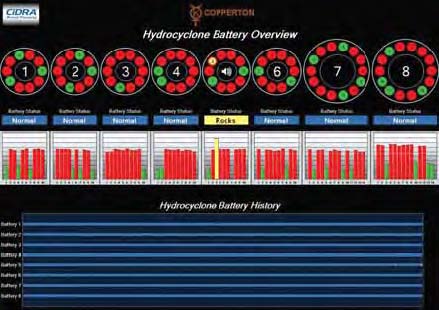
This event was isolated to a single cyclone, as shown on a screen shot of the control room interface in Figure 7, and the excursion in SPL and rock count is not detected on any of the other cyclones. The solid black line plotted with SPL is from Copperton's oversize particle monitor (in percentage of sample) from the combined overflow of all 10 cyclones in the battery. Thus an event that would have been general-ly associated with the whole battery has been isolated by CYCLONEtrac to the single cyclone affected.
The event terminated rapidly (at 800 seconds on the plot) when feed flow stopped to the effected cyclone by closing the isolation valve. The SPL dropped very quickly while the number of rocks and the oversize detector sig-nal roll off more slowly due to slower sample rates.
When rock events occur, the CYCLONEtrac system will alert the con-trol room operator that rocks are report-ing to the flotation system rougher banks allowing the operator, or the con-trol system, to correct the problem with-out shutting down the entire battery.
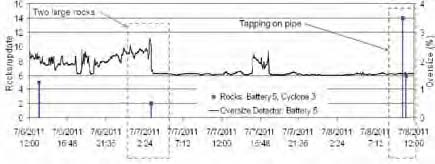
A short sampling campaign complet-ed in July 2011 was designed to further confirm the performance of the system. A sample basket assembly was attached to the overflow discharge of two cyclones on separate batteries for 24 hours and 48 hours, respectively. During these two sampling periods, the CYCLONEtrac system determined the number impacts on the pipe wall, indi-cating that rocks were reporting to the overflow of the particular cyclone under test. At the conclusion of the sampling period, the material collected in the basket was removed, dried and ana-lyzed. There was a correlation between the number of rocks (wall impacts) detected and the number of rocks col-lected. Of interest is that at the point where the rocks were detected, the combined overflow % oversize detector signal also spiked.
The number of rocks large enough to be detected was small, so it is only an assumption that the rocks collected were those causing the impacts. The highlighted region on the left side of Figure 8 shows the corresponding rise in the output of Copperton's oversize particle detector, at about 2:24 on July 7, 2011, and the two wall impacts that were detected by CYCLONEtrac at the same time (assumed to be the two large rocks that were recovered from the sam-ple basket).
Another simple verification test was performed by tapping on the overflow pipe adjacent to the sensor with a metal wrench to simulate wall impacts. While the impacts on the outside of the pipe cannot completely simulate those cre-ated by rocks on the inside of the pipe, they do test the capability of the system to respond to a series of sharp impacts. As a result of this test, the CYCLONEtrac system detected a rock event on cyclone No. 3, on the right side of Figure 8, at 10:00 on July 8, 2011. When the rock event was detect-ed, it triggered an alarm in the Copperton control room and initiated notifications to the CYCLONEtrac development team. Note that the over-size particle detector did not respond in this case as there was no change to the distribution of particles reporting to the overflow of the cyclone.
Value Realization
The measurement system was devel-oped to support detection of rock
events, however the main focus for
Copperton was identifying and resolving
system and operating issues to elimi-nate the source of oversize. Since the
full installation of the CYCLONEtrac
system there has been no significant
oversize events to fully realize the value
of the CYCLONEtrac. In parallel with
the CYCLONEtrac development, begin-ning in 2009, root cause analyses on
some oversize events identified the
SAG mill discharge as a problem. As a
result Copperton asset maintenance
tactics were improved, with a greater
focus on the health of:
• Paddle wheels (removes rocks from
trommel to form pebble crusher feed);
• Rubber skirts (prevents rocks from
entering SAG mill discharge sump);
and
• Jet nozzles (returns rocks to SAG mill
when pebble crusher is off line).
Operations tactics around oversize events also improved. More attention has been paid to equipment inspections and the response to events has been more immediate due the appreciation at the operating floor level of the signifi-cant economic impacts of such events.
The continued focus on the root cause of oversize events and immediate response to early indicators (in the SAG mills) has dramatically reduced large events impacting flotation. Nevertheless, the Copperton Concentrator now has a system that will detect rock events, is non-intrusive to the process and requires limited maintenance.
The CYCLONEtrac system has yet to be formally integrated into Copperton operations, primarily due to the fine tuning of the threshold parameters. The response to a cyclone in alarm state has been for an operator to sample the indi-vidual overflow stream for oversize and then sample the remaining cyclones in the battery. If the sample confirms there is oversize, the cyclone is isolated. If no oversize exists, the alarm is acknowl-edged and normal operation continues. The operating strategy and control response plans for such events require finalization and all operating crews will then be trained on the system.
Importantly, performance data is now available for each individual cyclone rather than the battery as a whole unit operation. The full potential of this data hasn't been fully explored but potential exists for data utilization from the operating mode output to be incorporated into routine cyclone main-tenance and replacement frequency.