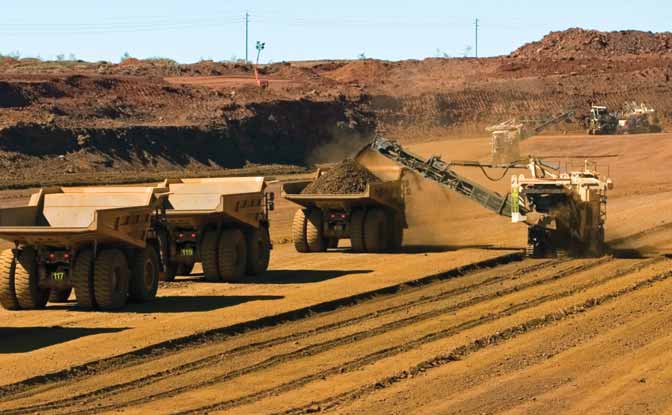
 Global iron ore production rose by more than 17% in 2010, reaching a record level of 1.8-plus billion mt. Shown here are mining activities in the Green Pit at
Fortescue Metals Group's Cloudbreak iron ore operations in Australia's Pilbara district. (Photo courtesy of Fortescue Metals Group)
The world iron ore market in 2010 was
dominated by a resurgence after the
stimuli packages, put in place in 2009
following the global financial crisis,
took effect. However, the industry experienced
rough times in 2009 and the
resulting changes following the economic
slump produced effects that
probably will live on as permanent features.
Trading patterns have been transformed,
and Chinese dominance has
become even more massive.
Steel Production: Up Globally, Growth Slower in China
World crude steel production increased
to 1.396 billion mt in 2010 from 1.201
billion mt in 2009, a change of 6.2%,
driven by the recovery of the world
economy and rising industrial production,
mainly in emerging countries but
also in the OECD area. Production was
well above the 2007 peak.
While China accounted for the entire
increase in 2009, production recovered
dramatically in the rest of the world in
2010, and it increased at a higher rate
than in China. Crude steel production
in China increased by 10.4%, a lower
rate than the 13.5% achieved in 2009.
Production in the rest of Asia increased
by a strong 20.5% and has now
regained pre-crisis levels, although it is
still lower than the peaks attained in
2005–2006. In Europe, production
rose by 18.7% but is still 10% below
that of 2008. In the Americas, production
grew by 30%, but was well below
the level reached before the recession.
All major producers experienced large
increases in production.
Monthly world crude steel production
had regained the pre-crisis peak by
May 2010. This was however almost
entirely due to China, where previous
peaks in monthly production were
matched already in April 2009. The rest
of the world had still not reached precrisis
production rates in May 2011.
The recovery is well under way and
appears to be solidly based, although
growth rates have declined from the
very high numbers reached in the early
stages of the upswing.
Record Iron Ore Production
A new all-time high for iron ore production
was achieved in 2010, at 1.827
billion mt (See Table 1). Production
grew by 17.6% over 2009's level and
well above 2008's previous high of
1.682 billion mt. Output increased in
most regions and countries except
Africa and Asia, excluding China, where
production in 2010 remained relatively
constant. Europe and North America
(Canada and United States) experienced
the highest growth rates, approaching
50%. Among the major producers Australian, Brazilian and Chinese production
was increased by 9.8%, 23%
and 41.6%, respectively. Indian production
declined somewhat to just above
210 million mt. Production in the CIS
countries grew by 14.4%.
Developing countries accounted for
58.6% of world iron ore production in
2010 (up from 57.8% in 2009), the
CIS republics for just over 11.1% and
the industrialized economies for almost
30.3%. The increase in the share of the
developing countries was due mainly to
growth in Brazil—up more than 70 million
mt—and China, up 96 million mt.
Chinese production, on a comparable
grade basis, was 315 million mt, or
17.3% of total world production in
2010, up from 14.3% in 2009 but
below the top level in 2007 of 370 million
mt.
World pellet production rose by 32%
in 2010 to 388 million mt up from 296
million mt in 2009 reaching a new
record level. This reflects a sharp
increase in demand for pellets in most
countries except the U.S. World exports
were 145 million mt, an increase of
46% over 2009. The share of pellets in
total iron ore production rose to 21% in
2010. Worldwide, several new pellet
plants are being planned or are under
construction.
Higher Demand Drives Record Iron Ore Trade
In 2010, international iron ore trade
reached a new record level as exports
increased for the ninth year in a row
and reached 1,053 million mt, up
12%. The increase was the result of
higher demand in the wake of the
recession. However, most countries
have not regained their 2008 import
levels. Developing countries accounted
for 49% of total iron ore exports in
2010, developed countries accounted
for 51%, including the CIS republics at
about 7%. Australia's exports increased
by 11% to 403 million mt in 2010.
With important markets in Europe and
the Americas picking up pace, Brazilian
exports, which fell in 2009, recovered
and increased 17% in 2010 to 311
million mt, up from 266 million mt.
Indian exports fell for the first time in
11 years but the country is still at 96
million mt, the third most important
exporter. Ukraine, Kazakhstan and
Russia increased their exports in 2010;
China has become an important market
for all three countries, but transport
capacity has been a limiting factor for
further expansion.
China is the world's largest iron ore
importer. In 2010, its imports were
619 million mt, a slight decrease compared
with 2009—but still representing
59% of total world imports. Almost
everywhere else, imports rose. Japan's
imports increased by 27% to 134 million
mt, and the Republic of Korea's by
34% to 56 million mt. European
imports (excluding the CIS countries),
increased by 40% in 2010, reaching
134 million mt. Seaborne trade in iron
ore reached a new high at 995 million
mt in 2010.
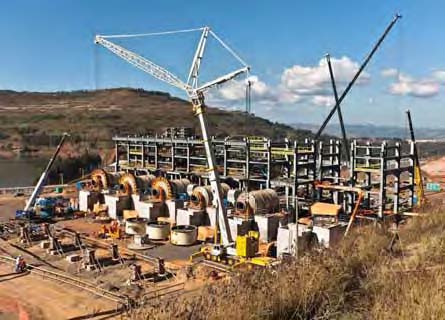 Vale, the leading iron ore producer, accounted for almost 17% of world iron ore output last year. Pictured
here is construction of Vale's newest iron ore beneficiation plant, located in the Itabira region of Brazil.
(Photo courtesy of Vale)
Pricing: Higher Volatility Ahead
The demise of the annual benchmark
pricing system was confirmed in 2010.
Currently, annual prices are still negotiated
between a small number of mining
companies, most importantly LKAB in
Sweden, and steel mills. The impact of
the disappearance of benchmark prices
on market transparency is mixed. On
one hand, there is very little information
about prices actually agreed-to by
identified parties. Full details about the
quarterly pricing system used by Vale,
for instance, have still not been published,
although the prices applied are
relatively widely known. On the other
hand, the introduction of at least three
competing price indices (Metal
Bulletin, Platts and The Steel Index)
has made it somewhat easier for market
participants to follow price movement
and trends.
Hedging opportunities have multiplied
rapidly and there are now several
marketplaces for the clearing of OTC
iron ore swaps. Two existing futures
contracts for iron ore (at the Indian
Commodity Exchange (ICEX) and the
Multi Commodity Exchange of India
(MCX)) will shortly be joined by a third,
at the Singapore Mercantile Exchange
(SMX), which will provide additional
hedging opportunities as well as a possibility
for investors to participate, something that should improve market
liquidity and give better assurance to
hedgers. In spite of the rapid growth in
the range of possible derivatives trades,
both iron ore mining companies and
steel mills have so far been relatively
slow to begin using the hedging facilities.
Based on experiences from other
markets, however, it is likely that modern
price risk management will play an
increasingly important role also in the
iron ore market.
When considering the future of iron
ore pricing, it is however also important
to understand that most iron ore is
still sold on long-term contracts and
that buying iron ore is not like buying
other metal concentrates. One of the
most important considerations for steel
mills is the consistency of quality of
the iron ore.
The full effects of the new pricing
mechanisms are not clear, but it is
unlikely the new model will have any
major effect on price levels. It is, however,
clear volatility will increase.
Moreover, steel companies from all
parts of the world will have added
incentive to increase captive production.
Chinese steel mills will invest
heavily in both domestic and overseas
projects. The contradictions building
between Vale, Rio Tinto and BHP
Billiton—the Big 3—and the Chinese
will not be resolved in the near future.
It will most likely take a few years to
settle them and the end could very well
be quite dramatic.
Except for a short decline in
April–June 2010, spot prices in China
have increased almost continuously
since early 2009. During the first half
of 2011, prices stagnated somewhat,
although they remain at levels that
must be characterized as extremely
high in a historical perspective.
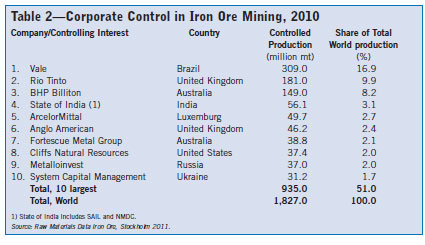
Corporate Concentration Remains Stable
Vale, Rio Tinto and BHP Billiton together
controlled 35% of world production
in 2010 (See Table 2). However, their
current market share is still lower than
the peak in 2005 at 36.4%. The
decline is the result of new production
being started in many countries as iron
ore prices returned to previous high levels
and in particular many of the small
Chinese producers restarted their production
in late 2009 and early 2010.
Brazil's Vale once again confirmed
its position as the world's largest iron
ore producer by increasing output by 54
million mt to reach an all-time high of
309 million mt and a market share of
16.9%. The second largest producer,
Rio Tinto, has a market share of 9.9%.
BHP Billiton increased its production
by 12 million mt to reach 149 million
mt in 2010.
Vale increased its market share and
is by far the top producer. Corporate consolidation decreased marginally
both at the level of the three largest
and the 10 largest companies. The
trend between 2005 and 2008 of
decreasing concentration has been broken
and we see a consolidation among
the top 10 producers. Corporate concentration
will resume its growth when
prices fall and many small Chinese producers
are forced to close.
To measure corporate control at the
production stage underestimates the
concentration of the iron ore sector
because large amounts of production do
not enter the market, but are produced
in captive mines or mines which have a
protected or restricted market. An alternative
way to measure the control is to
monitor the share of global seaborne
trade of the leading companies.
Measured this way, the shares of the
major companies are considerably higher.
Vale alone controls 26% of the total
world market for seaborne iron ore.
With the market shares of Rio Tinto and
BHP Billiton dropping in 2010, the
overall share controlled by the Big 3 fell
from 60% in 2009 to 58% in 2010.
New Capacity Onstream by 2013
New iron ore mining capacity that went
onstream in 2010, as identified at the
individual project level, reached 90 million
mt globally. This is up by 25 million
mt compared with 2009. The total project
pipeline in May 2011 included 815
million mt of new production capacity
that will come onstream between 2011
and 2013. Of this total, around 340
million mt falls into the "certain" category,
195 million mt "probable" and
280 million mt "possible."
Looking at the certain-category projects,
43% can be found in Oceania,
27% in Latin America, 6% in North
America, 16% in Europe and 9% for
Africa. The Raw Materials Group has
produced these estimates for a number
of years, and over this period an average
of some 75% of the total, including
all categories, has been recorded as
completed. This figure fell to 50% in
2011 as the effects of the financial crisis
limited new capacity coming
onstream in both 2009 and 2010.
Despite the uncertainties of each individual
project it may be assumed with a
reasonable degree of confidence that at
least 500 million mt and probably over
600 million mt of new capacity will
come onstream in the period up to and
including 2013. In the three-year period
following 2013, more than 325 million
mt of additional iron ore capacity is
listed with a completion date.
Given present circumstances and
extreme optimism in the market, most
of the projects in the pipeline will
advance and many new ones will be
announced. Were it not for the ability
of the Big 3 to regulate the pace at
which their projects are moved into
operation, the danger of reaching overcapacity
would seem considerable, particularly
if there are any hiccups in the
growth of steel production in the next
three years.
Outlook: Big Producers Gain More Leverage
The world economic outlook remained
uncertain as of mid-2011 and appears
less favorable than at this time last
year. The World Steel Association's latest
short-term forecast for world steel
use, presented in April 2011, anticipated
a rise in steel use by 5.9% in
2011, following the sharp increase by
13.2% in 2010. The increase in 2010
was higher than expected, due to the
unexpectedly good performance of the
world economy.
The industry experienced rough
times in 2009 and the changes that
took place brought on some effects that
probably will live on as permanent features,
mainly that the Chinese dominance
has now become even more massive.
It seems as if the Chinese economy
is capable of changing direction
toward internal growth and is in the
process of doing so, meaning it will be
less dependent on world demand for its
manufactured exports. Domestic
Chinese iron ore production is highly
sensitive to prices; domestic producers
will probably not be able to increase
output much beyond present levels and
production will drop precipitously when
iron ore prices start to fall.
The new pricing system gives major
producers more leverage. While the
international steel industry is not cohesive
and producers do not act in unison,
the three large iron ore producers
don't have to collude in order to exercise
considerable control over the market
and ensure that they are pursuing
mutually consistent strategies. Their
objective is obvious—to maximize profits—
and their method of achieving the
objective equally so: keeping prices
high enough to pay for new investment
but low enough so that new entrants do
not become realistic alternative
sources of product. The control exercised
by the Big 3 will, to some extent,
counteract the tendency to greater
price instability that will result from
the new pricing methods.
The Raw Materials Group estimates
iron ore use will increase from 1.818
billion tons in 2010 to about 1.910 billion
tons in 2011 and 1.990 billion mt
in 2012.
The background material for this article
is extracted from The Iron Ore Market
2010-2012, published by UNCTAD in
July 2011. This study was researched
and compiled by Raw Materials Group
for UNCTAD, and can be ordered by
e-mail at ironore@unctad.org, or by
fax from Amelie Zethelius Mermet at
+41-22 9170509. |
Despite a massive pipeline of investment
projects, the market will remain
tight over the next few years because
large iron ore producers can implement
their expansion plans with a great deal
of flexibility, and a considerable segment
of the Chinese iron ore mining
industry—probably representing as
much as 200 million mt in annual
capacity—would shut down if prices
were to fall much below present levels.
Accordingly, we believe that while the
market is certainly moving toward a balanced
supply and demand situation,
equilibrium will be reached in 2013 at
the earliest, and quite possibly not until
beyond that date. Prices, while declining
slowly, will stay sufficiently high to
keep the Chinese iron ore mining industry
operating at lower, but not disastrously
low, output. Thus, prices will
remain at levels that must be considered
high from a historical perspective,
with a floor at around $110-$120/mt
delivered in China.
Magnus Ericsson is a professor at the
Luleå University of Technology and a
senior partner and co-founder of Raw
Materials Group, Stockholm, Sweden
(www.rmg.se). Anton Löf is a research
analyst with RMG, specializing in the
global iron ore trade. Olle Östensson is
a senior adviser ar RMG.