E&MJ’s Annual Survey of Global Mining Investment
This year’s survey confirms that the economic engine driving mining investment
is running out of fuel
By Magnus Ericsson and Viktoriya Larsson, Raw Materials Group
The project fall-off accelerated during the second part of 2008 as metal prices imploded. During the first six months of 2008, 101 new projects were registered at a total cost of $50 billion, but in the third quarter the figure dropped to 34 projects and $17 billion and slumped even further in the last quarter to 23 projects at a total cost of only $14 billion. However, the situation is still far from the most recent low point: The $11 billion and 65 projects recorded for the entire year 2002.
As cost estimates of projects are updated during the year, the trend of escalating project costs noted earlier continues. However, we note that many projects are being expanded when moving from the feasibility to the construction phase and thus all cost increases can not be attributed solely to increasing unit costs. During 2008, the cost increases recorded in “old” projects— those registered before 2008—declined but still total about $40 billion compared with the total pipeline of projects in 2007, US$308 billion. This is mainly due to the discovery and development of more complex orebodies, often in remote locations, that may also be deeper lying with lower ore grades, as well as to increased costs for equipment, labor and materials.
Our previous conclusion that metal prices will be underpinned by a rising long term investment cost level still holds, in RMG’s analysis, but the level of these long term prices has dropped. However, RMG does not expect metal prices to drop to the levels experienced during the previous market slump.
More projects were completed during 2008 than in previous years, representing a total figure of $20 billion in capital investment. Presently, projects valued at a total of $37 billion are in the construction phase, up from $31 billion in 2007 and representing an increase of slightly under 20%, which is still less than last year’s equivalent figure.
This year’s survey shows current investment in brownfield projects to be $102 billion, a figure that is consistent with previous years, representing 25% of the total pipeline in relative terms. However, it is difficult to accurately monitor the progress of brownfield projects from project studies to construction because they are often carried out internally and quickly, without public disclosure. Thus, our total investment figure for projects under construction is undoubtedly an underestimate, particularly for this project category.
Typically, a project takes at least a year—usually even longer—to develop, depending on its size, location, existing infrastructure, availability of financing and many other factors. The volume of projects in early stages prior to a feasibility study has grown, indicating that there is still a steady flow of new projects into the pipeline but also that it is difficult to take projects beyond those initial phases. RMG’s earlier prediction that there will be a continued growth in projects under construction during 2008 was correct. In 2009 we anticipate a steep drop in project pipeline numbers if not an actual decline.
All of this year’s survey statistics are based on projects with an announced investment estimate. The RMD Metals database also includes approximately 2,000 projects—mostly in the conceptual stage—for which no investment figure has been announced. The investment total for all mining projects, including projects for which no investment estimate has been published, is much higher than our 2008 year-end estimate of $409 billion.
In 2008, the top 10 countries for mining investment increased their cumulative share of the global total to 68%, compared with 61% in 2007. Last year’s survey stated that “investments are more evenly spread around the globe,” perhaps a premature conclusion considering the long lead times in a mining project.
Papua New Guinea entered the top 10 list this year, narrowly edging Mexico. Australia still retains its Number One position with $53 billion worth of announced investments. Its growth over 2007 is, however, lower than the other Top 10 countries except South Africa, indicating an end to the unprecedented boom of the last few years. Canada remains in second place at $44 billion or 11% of the total. In third is Brazil, having increased its project pipeline slightly more than Australia.
Russia’s share grew tremendously during 2007 with its project pipeline more than doubling to reach $35 billion. After a period of consolidation the Russian mining industry has entered into an investment phase with huge new projects in iron ore, gold, copper and uranium. South Africa again fell, this time from fifth to seventh, its 10% increase in share indicating some of the difficulties investors perceive in Southern Africa in general. Peru remains in sixth place. The revived Frieda River copper project together with Marengo’s Yandera and the planned expansion at Lihir catapulted Papua New Guinea into the group of ten. Below the top ten cutoff are Mexico, New Caledonia, Democratic Republic of Congo, Argentina, China, Indonesia and Sweden in that order, each with a portfolio of projects totalling $5 billion to $8 billion.
Top Four Metals Grab 82%
of the Money
Copper, iron ore, gold and nickel, in that
order, are the most important investment targets
for mining companies. These metals
account for 82% of the total project pipeline.
They also dominate the mining business
in terms of the total value of its output,
together they are valued at $336 billion.
Iron ore has been under-represented in the project pipeline for many years, but since 2004 continued high demand for iron ore and healthy increases in prices paid have made iron ore one of the hottest investment targets. Of the total amount of investments into new projects presented in 2008, 33% are iron ore projects but the level of investment is down from 2007 both in relative (50%) and absolute terms ($27 billion). Vale’s giant Serra Sul project in Carajas, Brazil, alone is estimated at over $10 billion. Consequently, iron ore investments have jumped from fourth place to second place in the total ranking, almost catching up with copper in 2007. At present it appears that iron ore demand and prices will not fall as dramatically as some of the base metals and thus the volume of iron ore projects might continue to grow.
Copper increased its share of the total pipeline while both gold and nickel decreased. During 2008, the number of uranium projects grew—particularly when oil prices hovered at record high levels. We have chosen to report the energy metal separately in this year’s survey. The “Other” category, including silver, cobalt, tin and ferroalloys projects, increased somewhat if the exclusion of uranium is taken into consideration. Investment for platinum group metals (PGMs) was constant during 2008. Lead and zinc’s share of total investment decreased in concert with falling zinc prices in 2008.
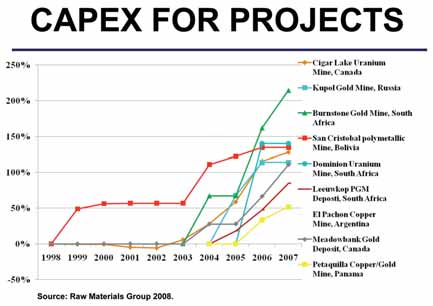
Gold projects are usually less expensive than copper projects, and although gold projects have risen to an average capital cost of $165 million in 2008 compared with $130 million last year, that figure is much less than the $480-million-plus average project cost for copper. This is due to the fact that it is still possible to find small but high-grade gold deposits which can be mined profitably by junior or mid-sized companies, while most new copper projects are often huge, low-grade open pit operations, often distant from existing infrastructure.
The average cost of an iron ore project is much higher than that of copper, now standing at well over $670 million, compared with $500 million in 2007. Nickel projects used to be the most costly of all, with new laterite technologies being technically more demanding and ore grades low, necessitating haulage of large volumes of ore and waste, but iron ore projects have now surpassed them. PGM projects have an average cost somewhere between those of copper and gold projects, while zinc projects are generally in the same range as gold projects.
When comparing average investment costs over the last few of years, capex increases become obvious. The chart on the top of page 25 contains projects that have not increased their projected output volumes over the years. The slowdown in cost increases noted already in last year’s Project Survey continued in 2008.
Among the new projects listed by RMG during 2008 copper dominates, accounting for more than 36% (27% in 2007) of the value of all new projects. Iron ore follows with 27% (47%). Gold with 10% of the newly announced projects has declined rapidly from 17% in 2006. Nickel is at 7%, half the level achieved during its market peak.
About This Survey This survey includes all countries with known projects. In the process chain from ore to metal, its main focus is on the mining stage. Pure smelter projects are not listed. In some cases, however, where the process is fully integrated from mining to refining, such as acid pressure leach hydrometallurgical nickel projects, all stages are included. Eligibility for a full listing requires each project to have an announced investment cost estimate, reserve/resource data and an estimated annual production figure. Comparability of information from different companies, countries and regions varies, as specific project information or definition may be unclear for various reasons, or the project may also involve large unreported infrastructure costs. Raw Materials Group attempts to resolve these factors, but cannot rectify all discrepancies arising from definitions and comparability. Information contained in the survey is global in scope. However, it should be noted that completely accurate coverage of some regions is difficult to attain due to lack of information or corporate reporting standards and requirements. In total, mine projects are included from more than 70 countries and the surveys aggregate figures are considered to reflect overall investment trends in the mining industry reasonably accurately. For more information, visit www.rmg.se or call +46-8-7440065. |