Exploration Spending Continues to Set Records
MEG estimates that the budgets of the companies covered by the study (using a $100,000 cutoff) account for more than 95% of worldwide commercially oriented nonferrous expenditures. When the remaining 5% is added, estimated spending for commercial nonferrous metals exploration reaches $10.5 billion—a 40% increase over last year’s estimated total and more than double the estimated $5.2 billion at the height of the last exploration cycle in 1997.
MEG said it does not adjust its historic exploration figures for inflation to attempt constant-dollar comparisons, but informal calculations show more is being invested in exploration today than a decade ago. However, the report states that it is “certain that in most parts of the world, today’s exploration dollar does not go as far as it did a decade ago.”
Increased demand for services such as drilling and assaying and rising input costs on everything from fuel to geoscientists have significantly increased the costs of exploration in the current cycle. As a consequence, it is unlikely that the substantial increase in exploration budgets over the past few years has resulted in a proportionate rise in actual activity on the ground, the study concludes.
This year’s report—the 18th in the series—includes uranium exploration budgets for the first time, with 363 companies (159 of which are exploring solely for uranium) allocating $936 million to uranium in 2007. Inclusion of uranium budgets increased the total number of companies surveyed to 1,980 and the aggregate exploration budget to almost $10.93 billion; including estimates for budgets that MEG said it could not obtain, its estimate of worldwide 2007 exploration expenditures including uranium totals more than $11.4 billion.
Excluding these uranium exploration expenditures, however, the study notes that companies at all levels of the industry have substantially increased their budgets over the past five years, but the junior sector is clearly driving the current exploration upswing. In fact, junior exploration spending has increased 909% since the bottom of the cycle in 2002, accounting for more than half of the overall year-on-year increase in each of the last four years, and for more than half of the 2006 and 2007 worldwide total.
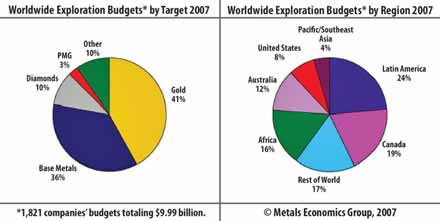
With prices for copper, nickel and zinc at or near their all-time highs, the percentage of overall exploration spending attributable to base metals (which has maintained an inverse relationship to gold over the past decade) has increased substantially in recent years.
Since 1994, Latin America has been the most popular destination for exploration, with just under 24% of worldwide spending in 2007. About 83% of this year’s $2.4 billion allocation is directed to the traditional big five Latin American countries—Mexico, Peru, Chile, Brazil and Argentina. Canada has held the second spot since overtaking Australia in 2002, and represents about 19% of worldwide spending in 2007. The rest-of-world region, which includes most of mainland Asia, Europe and the Middle East, holds third place for the second year in a row, accounting for 17% of total 2007 spending. Close behind is Africa at 16%; major exploration destinations on the continent include South Africa, Democratic Republic of Congo, Angola, Tanzania, Botswana and Ghana, which collectively account for almost two-thirds of the continent’s 2007 exploration total. Although in fifth place by region for the fourth year in a row, Australia recorded the largest relative yearon- year increase this year (up 57%), increasing its share of worldwide spending from 11% to 12%.
The United States remains in sixth place, falling within the same range of 7%–8% of worldwide spending it has held for the past seven years. In the Pacific/ Southeast Asia region, allocations rose 55% over last year’s total, with Papua New Guinea, the Philippines and Indonesia collectively contributing almost three-quarters of the total. The region’s 4% of the worldwide total ranks it last among all regions.
Grassroots spending maintained its 39% share of the worldwide budget for the second consecutive year, while minesite allocations increased the most on a yearon- year basis (up 57%) at the expense of late-stage budgets to account for about 20% and 41%, respectively, of total allocations this year. Nonetheless, aggregate late-stage budgets continue to outweigh grassroots allocations for the third consecutive year after surpassing grassroots budgets for the first time in 2005.
The report, titled Corporate Exploration Strategies–18th Edition, is available on the Web and in print from Metals Economics Group (www.metalseconomics.com).